Fig. 4.
Download original image
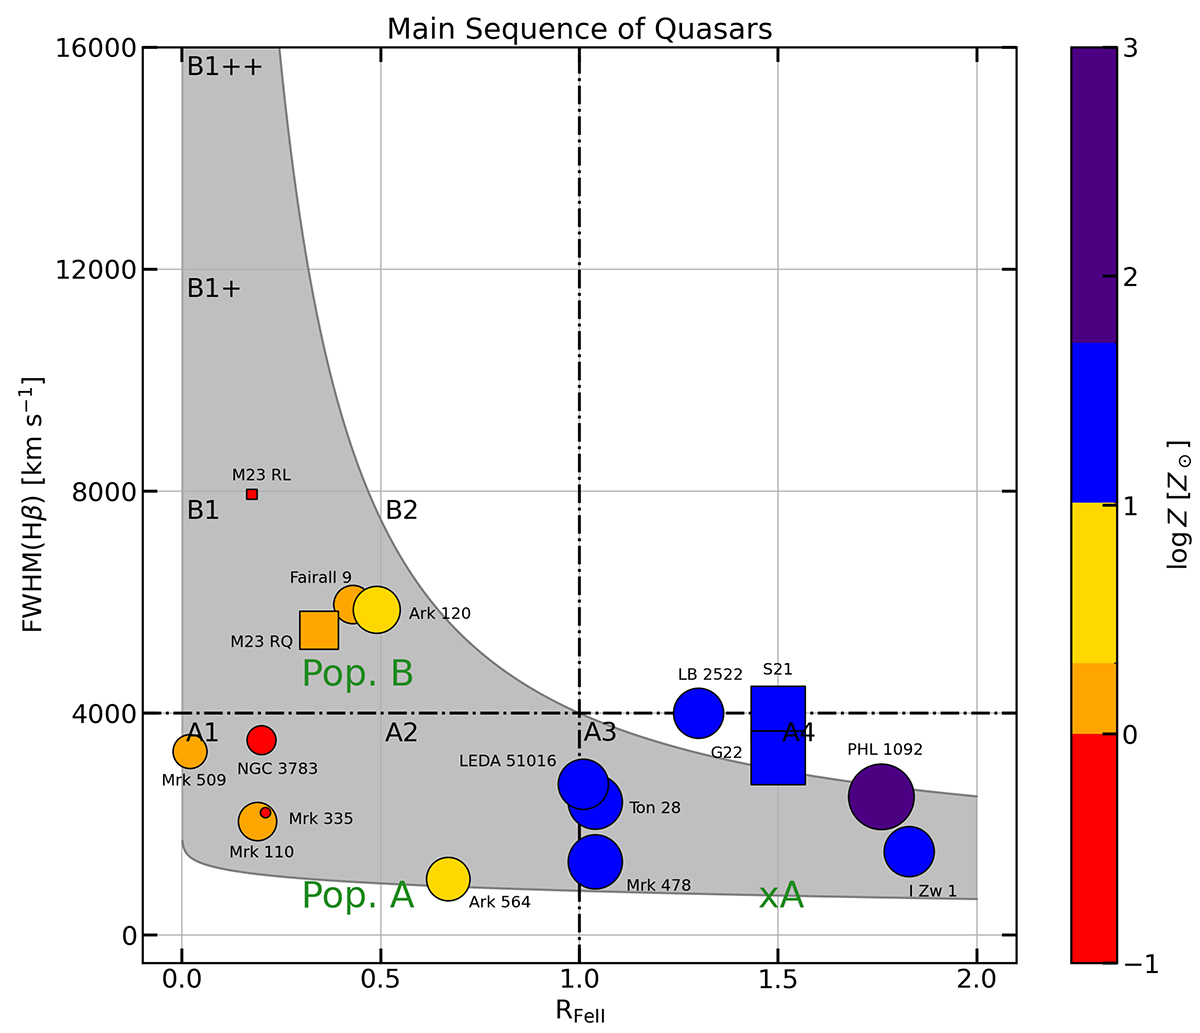
MS representation of our sample. Every object is placed according to its RFeII and FWHM(Hβ). Greater metallicity, Z, is expressed with increasing marker sizes and different colors. Objects with subsolar metallicity are marked in red, objects with 1 Z⊙ ≤ Z ≤ 2 Z⊙ in orange, objects with 2 Z⊙ < Z ≤ 10 Z⊙ in gold, objects with 10 Z⊙ < Z ≤ 50 Z⊙ in blue, and objects with metallicity greater than 50 Z⊙ in indigo. Sources from this work are shown in circles. Squares are used as reference values for the objects in S21, G22, and M23, the latter with two squares, one for RL sources and the other for RQ sources. The gray region describes the typical positions occupied by objects along the MS (Zamfir et al. 2010; Garnica et al. 2022).
Current usage metrics show cumulative count of Article Views (full-text article views including HTML views, PDF and ePub downloads, according to the available data) and Abstracts Views on Vision4Press platform.
Data correspond to usage on the plateform after 2015. The current usage metrics is available 48-96 hours after online publication and is updated daily on week days.
Initial download of the metrics may take a while.