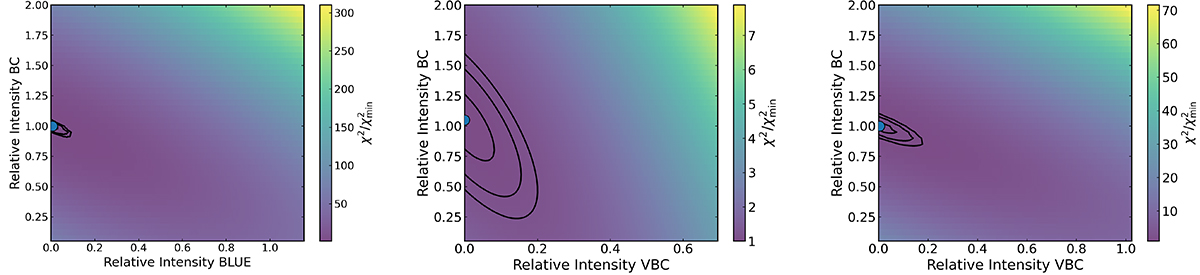
Fig. 3.
Download original image
Left: plot of the χ2/χmin2 distribution as a function of the relative intensity of the FeIIBC of PHL 1092 with respect to the specfit retrieved intensity, vs. the relative intensity of the FeIIBLUE with respect to the original intensity of FeIIBC. Middle: same, but for the AlIIIVBC emission of Fairall 9. Right: same, but for the FeIIVBC emission of Fairall 9.
Current usage metrics show cumulative count of Article Views (full-text article views including HTML views, PDF and ePub downloads, according to the available data) and Abstracts Views on Vision4Press platform.
Data correspond to usage on the plateform after 2015. The current usage metrics is available 48-96 hours after online publication and is updated daily on week days.
Initial download of the metrics may take a while.