Fig. 10.
Download original image
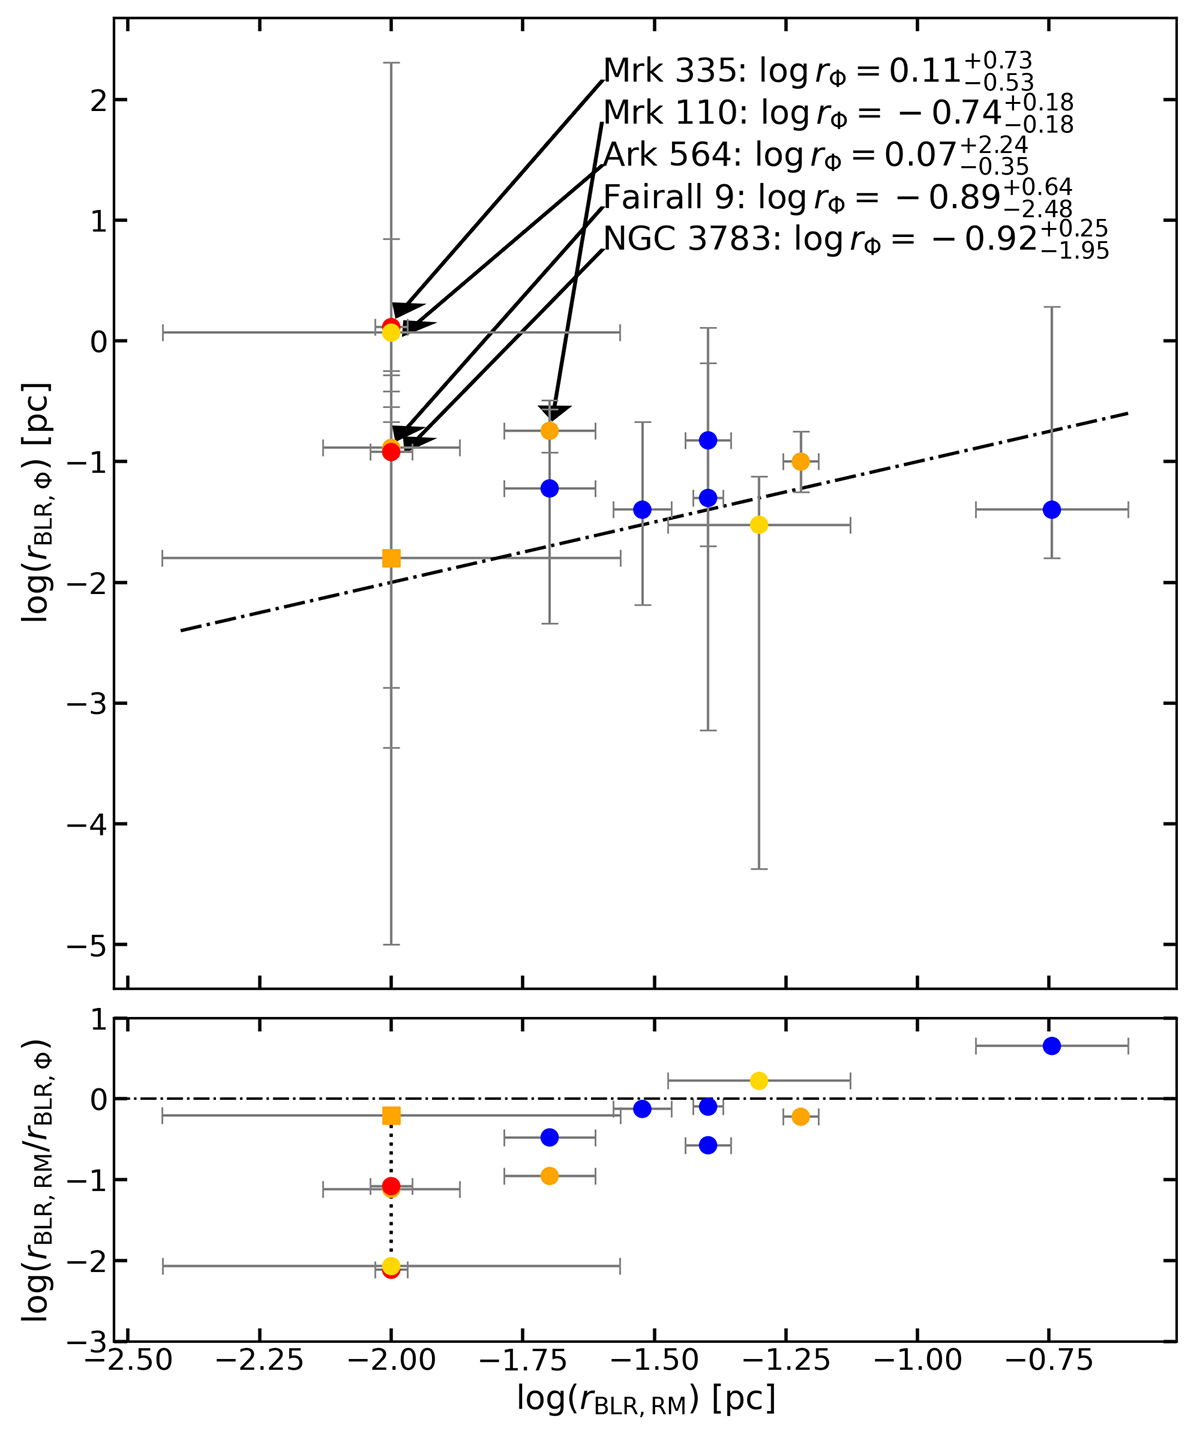
Top: scatter plot showing the comparison of rBLR estimated with reverberation mapping (rBLR, RM), and using CLOUDY photoionization simulations (rBLR, Φ), on a logarithmic plane. Points are displayed using the same color-coding as in Figure 4, with their respective error bars. The dash-dotted line describes the position of objects for which the two independent determinations coincide. The values of rBLR, Φ for objects whose determinations do not coincide with rBLR, RM by a margin are shown in the upper right quadrant of the figure (expressed in pc), connected to their representative points through an arrow. An alternative result of the determination of physical parameters is shown for Ark 564 with a square, obtained by removing the diagnostic ratios employing CIII]. Bottom: plot showing the difference between the two estimations. The horizontal dash-dotted line describes the position of objects for which the two independent determinations coincide. The dotted line connects the two different determinations for Ark 564 described above.
Current usage metrics show cumulative count of Article Views (full-text article views including HTML views, PDF and ePub downloads, according to the available data) and Abstracts Views on Vision4Press platform.
Data correspond to usage on the plateform after 2015. The current usage metrics is available 48-96 hours after online publication and is updated daily on week days.
Initial download of the metrics may take a while.