Open Access
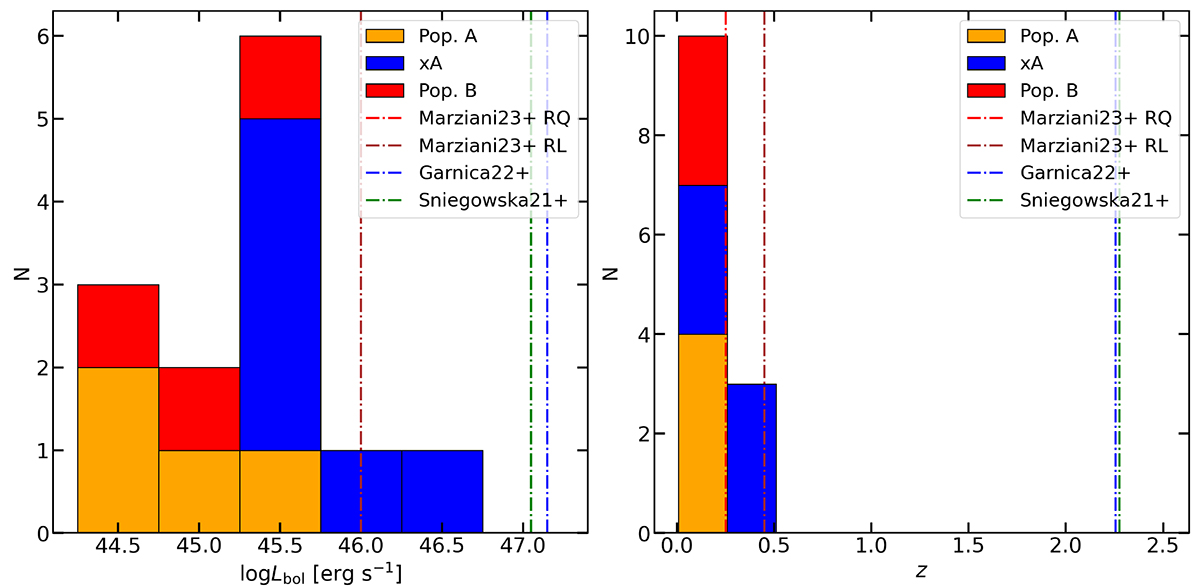
Fig. 1.
Download original image
Stacked histograms depicting the distribution of sample objects in log(Lbol) and z, categorized by the respective population. Assigned colors correspond to the legend, while vertical lines denote average values from the objects used in the referenced works S21, G22, and M23.
Current usage metrics show cumulative count of Article Views (full-text article views including HTML views, PDF and ePub downloads, according to the available data) and Abstracts Views on Vision4Press platform.
Data correspond to usage on the plateform after 2015. The current usage metrics is available 48-96 hours after online publication and is updated daily on week days.
Initial download of the metrics may take a while.