Fig. 7.
Download original image
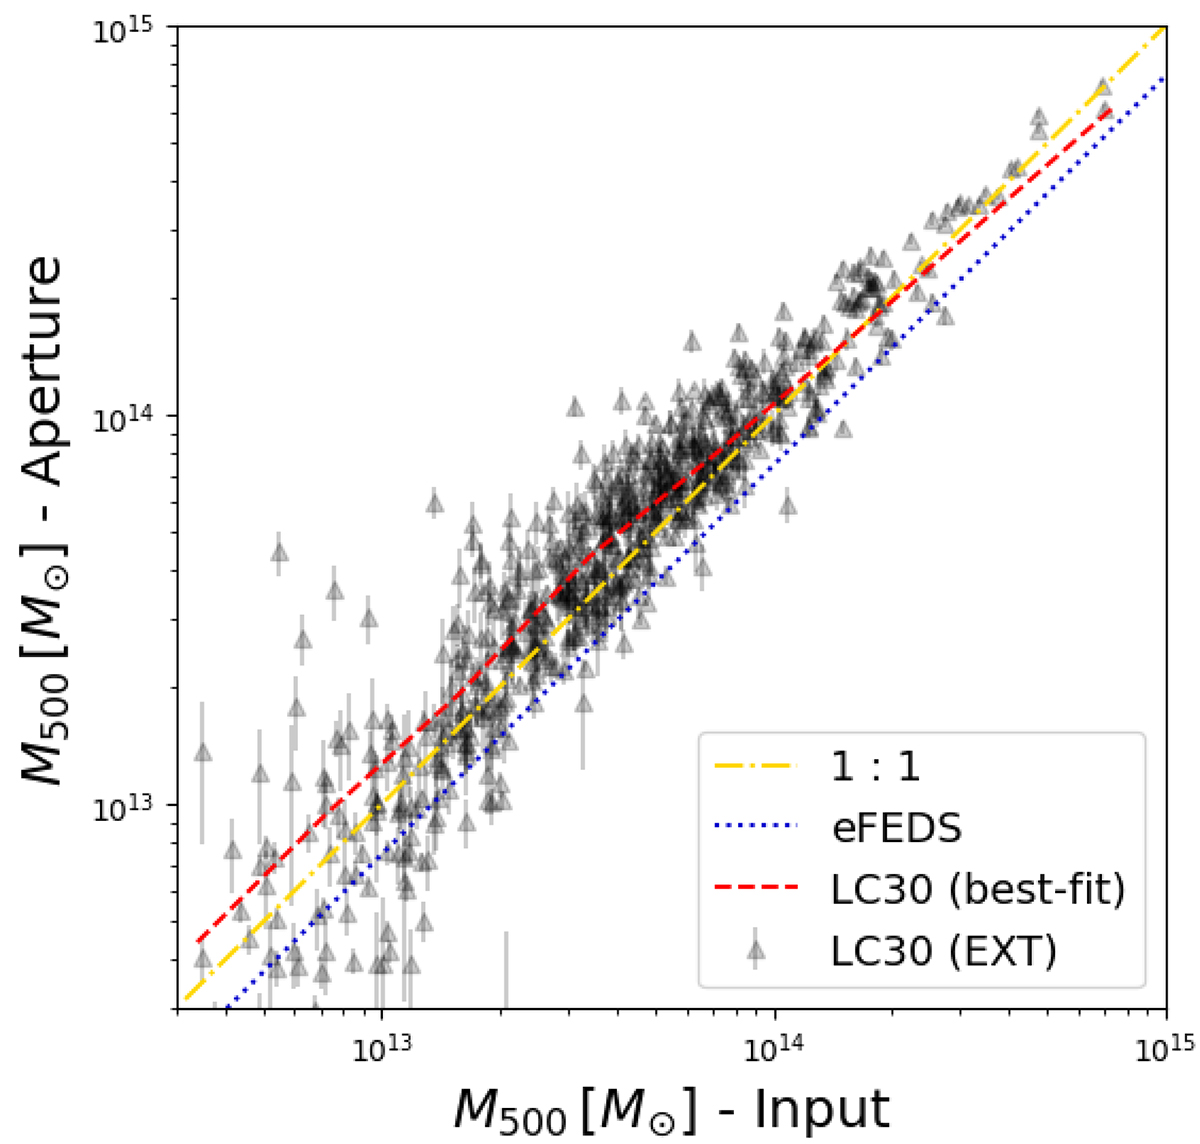
Comparison of the mass distribution in the input catalogue and derived from the scaling relation L500 − M500 in Lovisari et al. (2015). The errors are derived from the 16th and 84th percentile in the luminosity measurement. In dash-dotted yellow, we report the 1:1 relation; in dashed red the best fit from the scatter plot. Additionally, we determine the mass using the scaling relation derived from eFEDS data in Chiu et al. (2022) and plot its best fit as dotted blue.
Current usage metrics show cumulative count of Article Views (full-text article views including HTML views, PDF and ePub downloads, according to the available data) and Abstracts Views on Vision4Press platform.
Data correspond to usage on the plateform after 2015. The current usage metrics is available 48-96 hours after online publication and is updated daily on week days.
Initial download of the metrics may take a while.