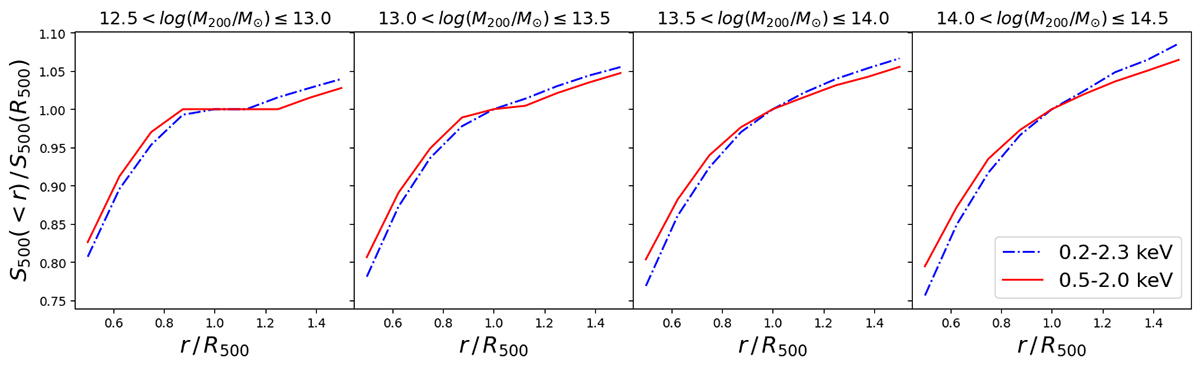
Fig. B.1.
Download original image
Fraction of the flux within different apertures over the flux in R500. The estimates are performed for two energy bands: 0.5 − 2.0 keV plotted with a red solid line and 0.2 − 2.3 keV with a dash-dotted blue line. The plots represent the medians obtained within the different halo mass bins.
Current usage metrics show cumulative count of Article Views (full-text article views including HTML views, PDF and ePub downloads, according to the available data) and Abstracts Views on Vision4Press platform.
Data correspond to usage on the plateform after 2015. The current usage metrics is available 48-96 hours after online publication and is updated daily on week days.
Initial download of the metrics may take a while.