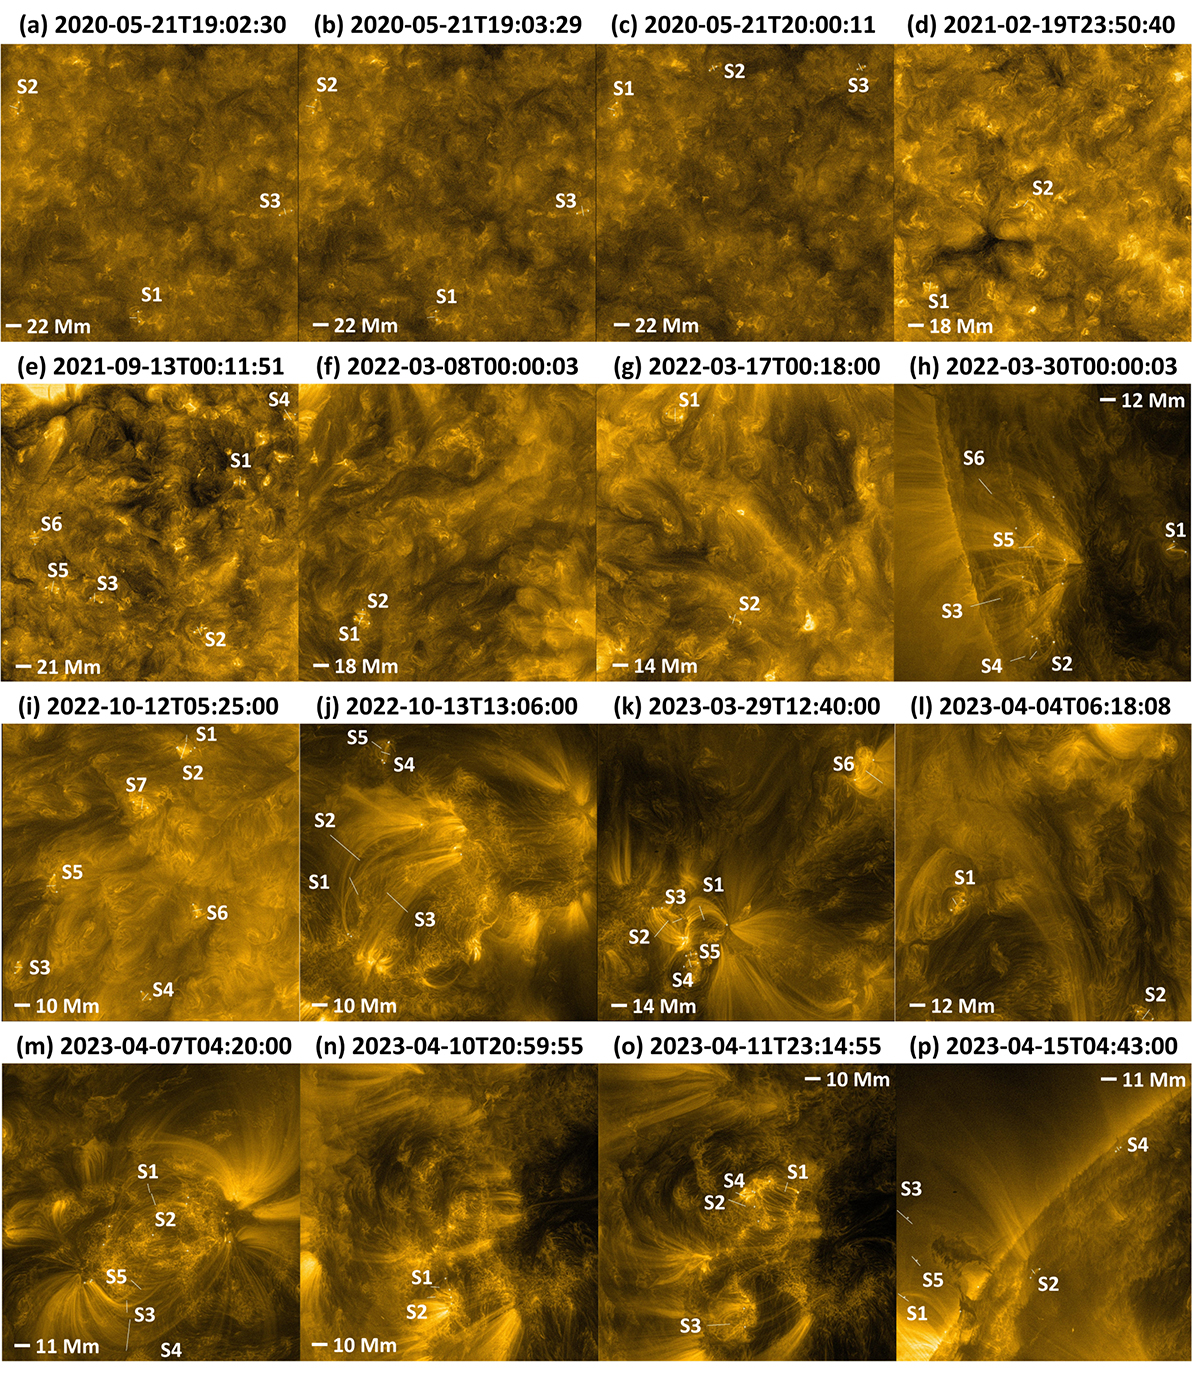
Fig. A.1.
Download original image
Solar Orbiter/EUI HRIEUV 174 Å full FOV images for each of the 16 data sets. The image has been enhanced using the Multiscale Gaussian Normalization (Morgan & Druckmüller 2014). The observation date and start time are displayed above each image. In each panel, the white solid lines mark the positions of the artificial slits that are used for generating the time–distance maps. The white plus symbols in each panel show the approximate position of footpoints for on-disc loops and the position of the apex and the centre between two footpoints for limb loops. Some loops share the same footpoint. The details of the data set are provided in Table 1. The spatial scale is indicated as a thick white bar in each panel.
Current usage metrics show cumulative count of Article Views (full-text article views including HTML views, PDF and ePub downloads, according to the available data) and Abstracts Views on Vision4Press platform.
Data correspond to usage on the plateform after 2015. The current usage metrics is available 48-96 hours after online publication and is updated daily on week days.
Initial download of the metrics may take a while.