Fig. 5.
Download original image
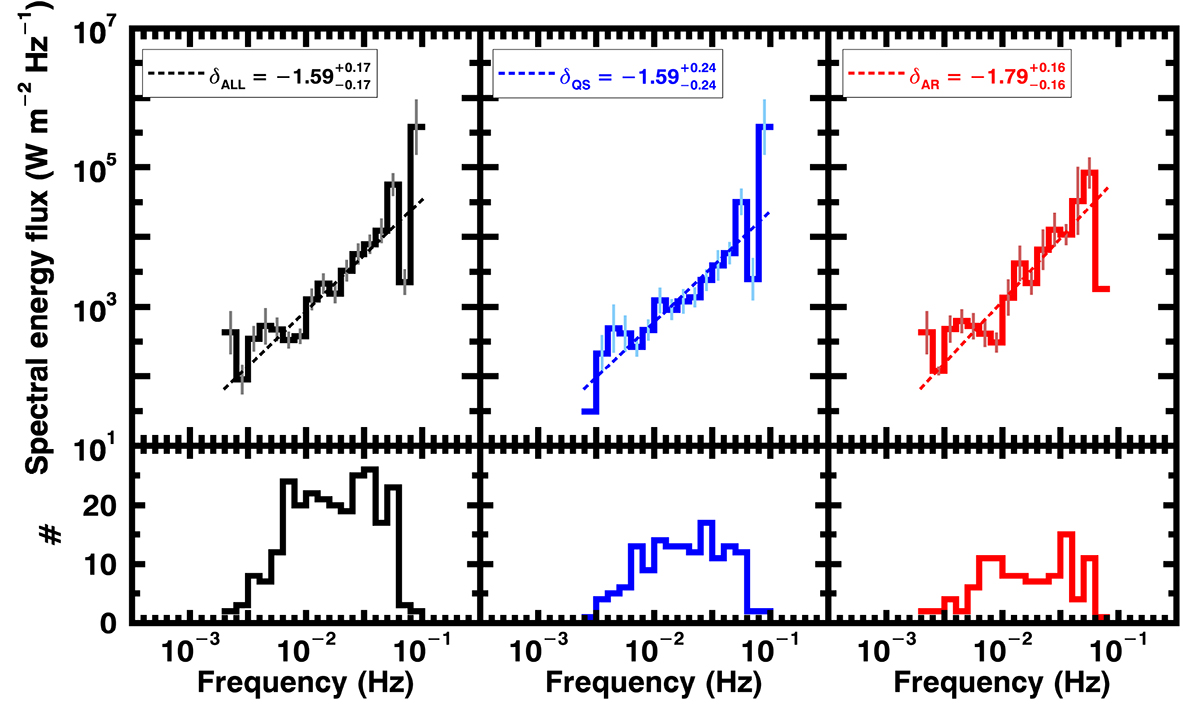
Distribution, s(ω), of spectral energy fluxes as a function of oscillation frequency (top panels) and the number of oscillations for each frequency bin (bottom panels). The vertical bars show an uncertainty of (![]() ). A bin size of 0.1 has been considered. The best fits of distributions are shown as dashed lines. The fitting was only considered for bins containing more than one case. Blue, red, and black represent oscillations in the QS, ARs, and all regions, respectively. The power-law slopes are δQS = −1.59 ± 0.24, δAR = −1.79 ± 0.16, and δALL = −1.59 ± 0.17, respectively.
). A bin size of 0.1 has been considered. The best fits of distributions are shown as dashed lines. The fitting was only considered for bins containing more than one case. Blue, red, and black represent oscillations in the QS, ARs, and all regions, respectively. The power-law slopes are δQS = −1.59 ± 0.24, δAR = −1.79 ± 0.16, and δALL = −1.59 ± 0.17, respectively.
Current usage metrics show cumulative count of Article Views (full-text article views including HTML views, PDF and ePub downloads, according to the available data) and Abstracts Views on Vision4Press platform.
Data correspond to usage on the plateform after 2015. The current usage metrics is available 48-96 hours after online publication and is updated daily on week days.
Initial download of the metrics may take a while.