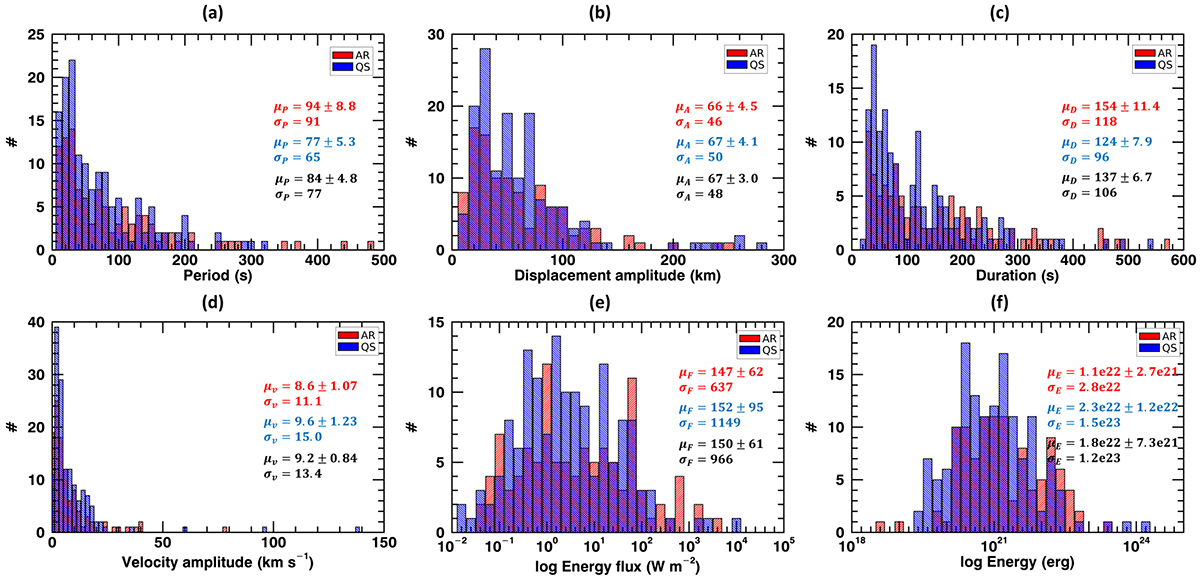
Fig. 3.
Download original image
Histogram of (a) the period, (b) the displacement amplitudes, (c) the duration, (d) the velocity amplitude, (e) the energy flux in log scale, and (f) the energy in log scale in QS (blue hatched bar) and ARs (red hatched bar). The average (μ) and standard deviation (σ) of each parameter for QS (blue), ARs (red), and all regions (black) are indicated in each panel. Each average value is presented with its uncertainty as ![]() , where n is the number of detected oscillations. The physical unit of each parameter is shown on the x-axis in each panel.
, where n is the number of detected oscillations. The physical unit of each parameter is shown on the x-axis in each panel.
Current usage metrics show cumulative count of Article Views (full-text article views including HTML views, PDF and ePub downloads, according to the available data) and Abstracts Views on Vision4Press platform.
Data correspond to usage on the plateform after 2015. The current usage metrics is available 48-96 hours after online publication and is updated daily on week days.
Initial download of the metrics may take a while.