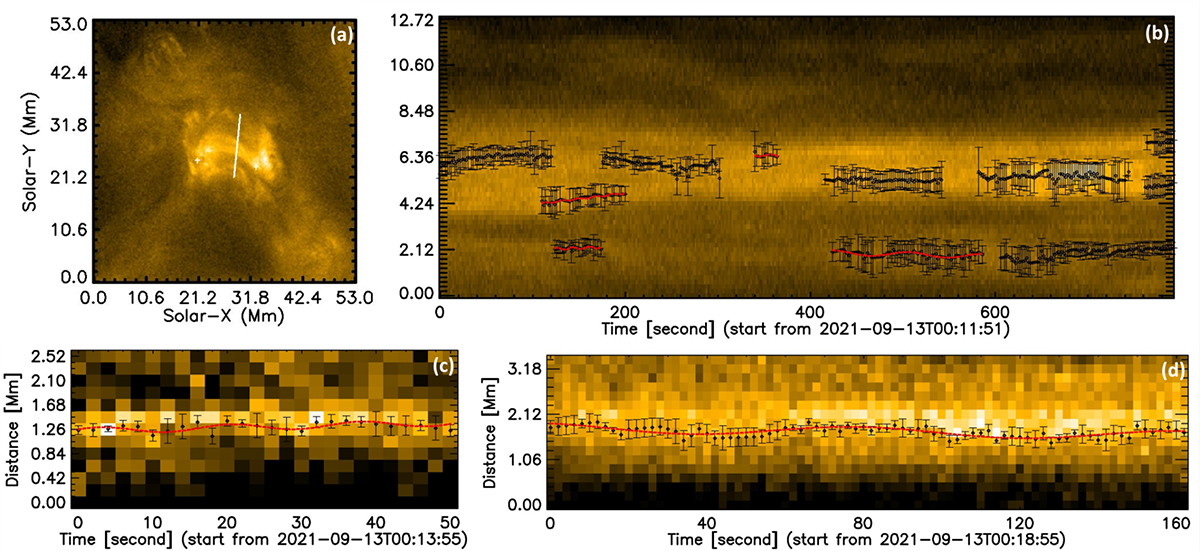
Fig. 2.
Download original image
An example of detected oscillations. (a) Magnified view of the loop with slit S1 (white solid line) and its footpoints (white plus) on 2021 September 13. (b) Time–distance map made from the slit presented in panel (a). The black diamond and error bars indicate the detected loop centres and minor radius. The red dashed line outlines their sine fits that meet all criteria. The close-up view of fitted oscillations is shown in (c) and (d). In this case, error bars represent position errors.
Current usage metrics show cumulative count of Article Views (full-text article views including HTML views, PDF and ePub downloads, according to the available data) and Abstracts Views on Vision4Press platform.
Data correspond to usage on the plateform after 2015. The current usage metrics is available 48-96 hours after online publication and is updated daily on week days.
Initial download of the metrics may take a while.