Fig. 9
Download original image
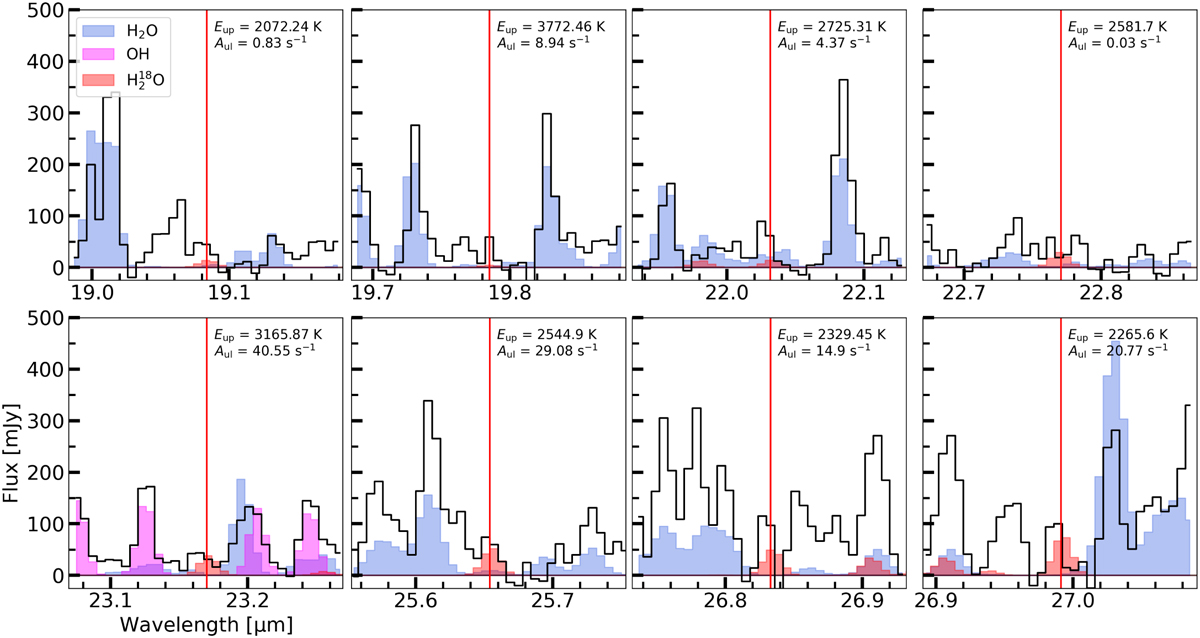
Zoom-ins on the isolated H2 18O lines, highlighted by the red vertical line. A simple H2 18O slab model (T = 350 K, log10 (N) = 17.66, and Rem = 1.0 au) is shown in red, whereas the best models of H2O (three component fit accounting for both the radial and vertical temperature gradient) and OH are shown in blue and magenta, respectively. For each transition, we have listed the upper level energies and Einstein-A coefficients.
Current usage metrics show cumulative count of Article Views (full-text article views including HTML views, PDF and ePub downloads, according to the available data) and Abstracts Views on Vision4Press platform.
Data correspond to usage on the plateform after 2015. The current usage metrics is available 48-96 hours after online publication and is updated daily on week days.
Initial download of the metrics may take a while.