Fig. 8
Download original image
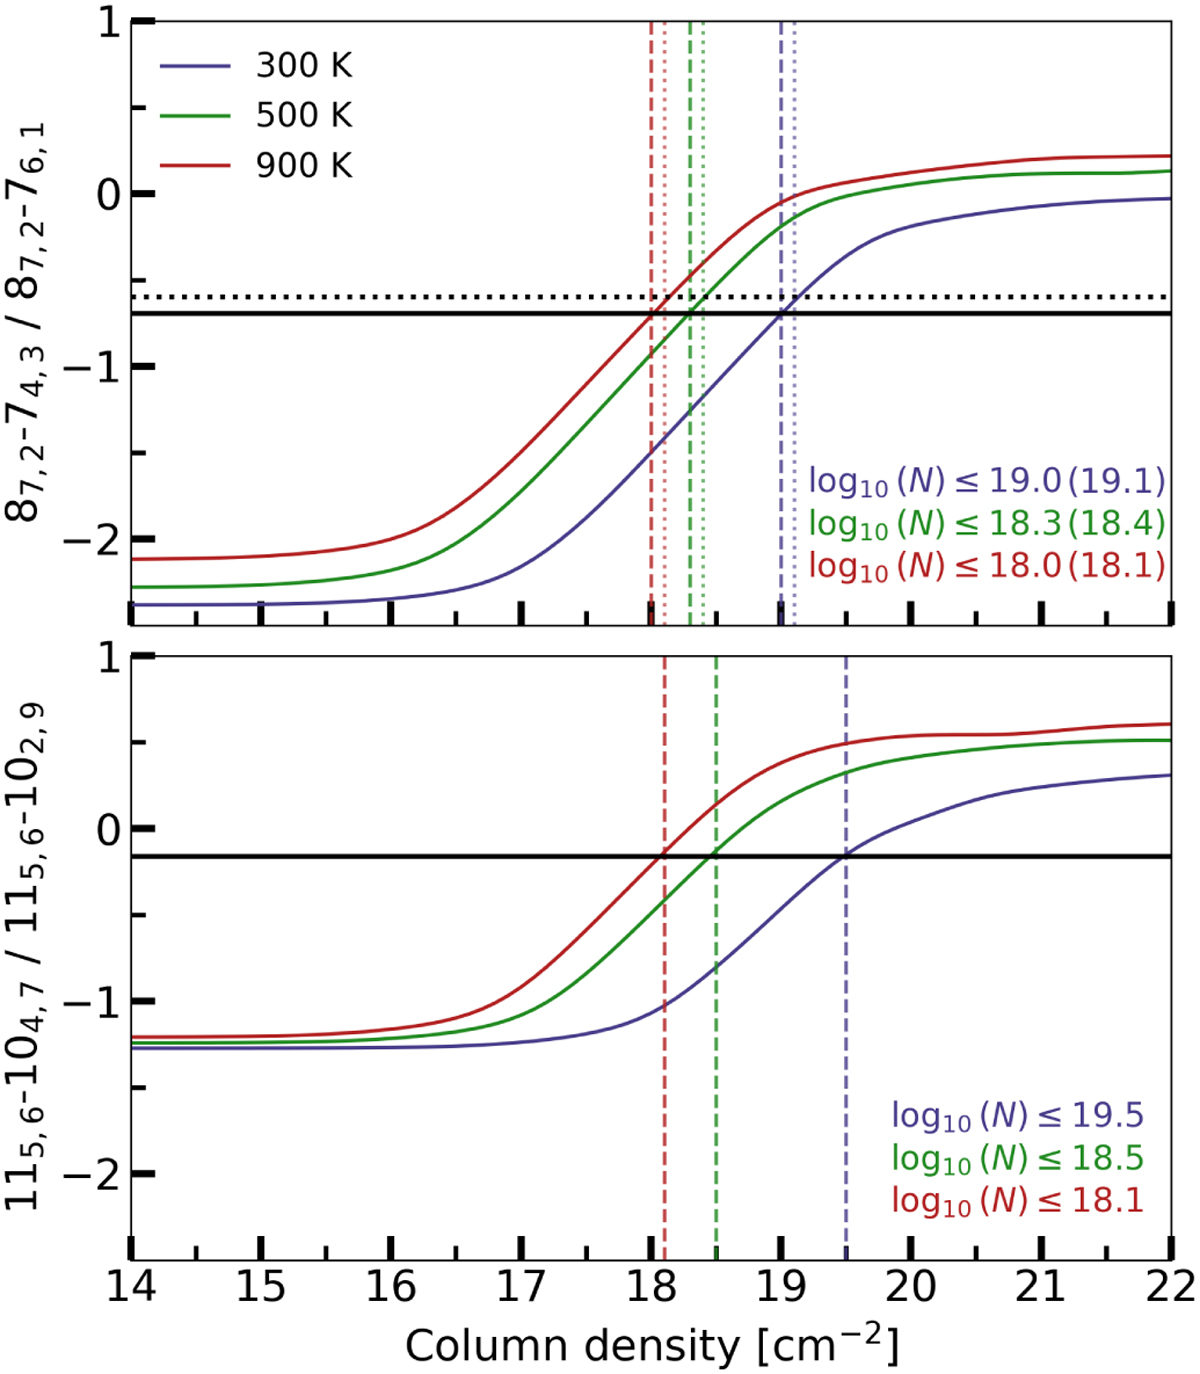
Logarithm of the line flux ratios as a function of the logarithm of the column densities (in cm−2) for the line pairs with similar upper level energies. The ratios for the slab models with T =300 K are shown in blue, whereas those for T = 500 K and T = 900 are shown in green and red, respectively. The horizontal black line indicates the line ratio taken from the continuum-subtracted spectrum of DR Tau. The dashed, vertical lines indicate where the different model ratios equal the observed line ratio. In addition, the dotted lines and the column densities listed in parenthesis indicate the results for the top line pair after subtracting off the contribution of the component with the lowest temperature (see Sect. 3.3).
Current usage metrics show cumulative count of Article Views (full-text article views including HTML views, PDF and ePub downloads, according to the available data) and Abstracts Views on Vision4Press platform.
Data correspond to usage on the plateform after 2015. The current usage metrics is available 48-96 hours after online publication and is updated daily on week days.
Initial download of the metrics may take a while.