Fig. 6
Download original image
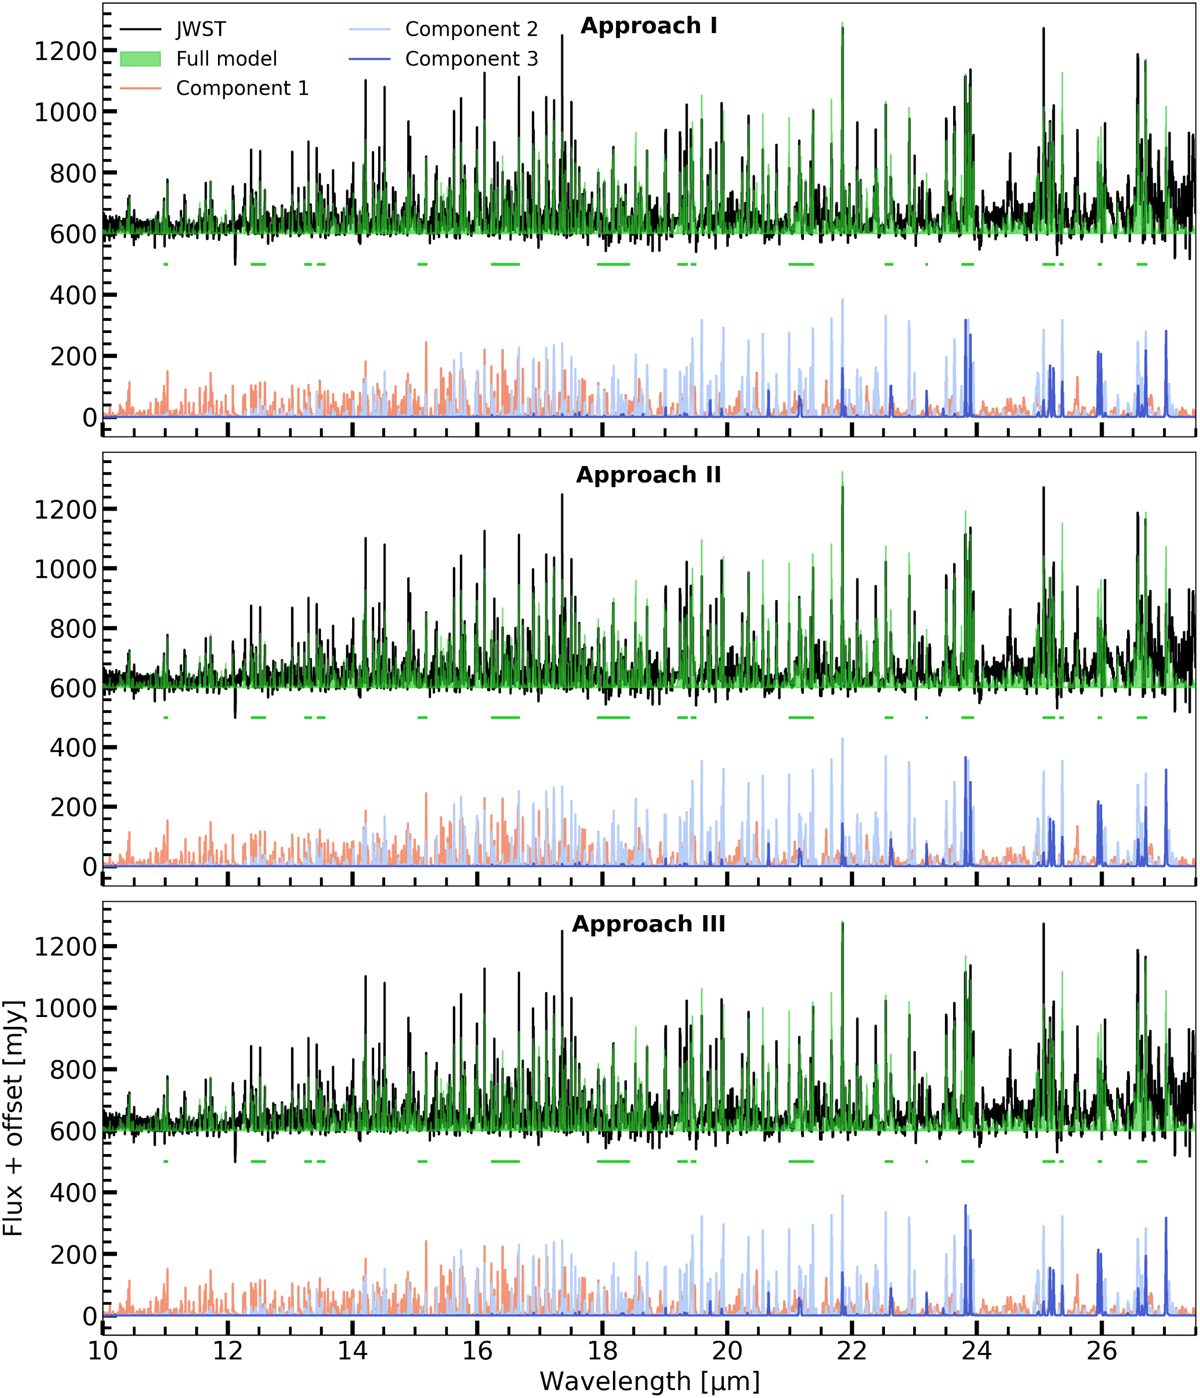
Multi-component slab model fits for the different methods of radial gradients: method 1 (radial temperature gradient, without overlapping regions) is shown in the top panel, whereas the methods 2 (radial gradients with overlapping regions, but no line shielding) and 3 (radial and vertical temperature gradients) are displayed in the middle and bottom panels, respectively. The full model is in each panel shown in green, whereas the components are coloured depending on the corresponding temperatures. Red indicates the hottest component, followed by the light blue and dark blue ones. The green horizontal bars indicate the regions used in the ![]() -fits.
-fits.
Current usage metrics show cumulative count of Article Views (full-text article views including HTML views, PDF and ePub downloads, according to the available data) and Abstracts Views on Vision4Press platform.
Data correspond to usage on the plateform after 2015. The current usage metrics is available 48-96 hours after online publication and is updated daily on week days.
Initial download of the metrics may take a while.