Fig. 4
Download original image
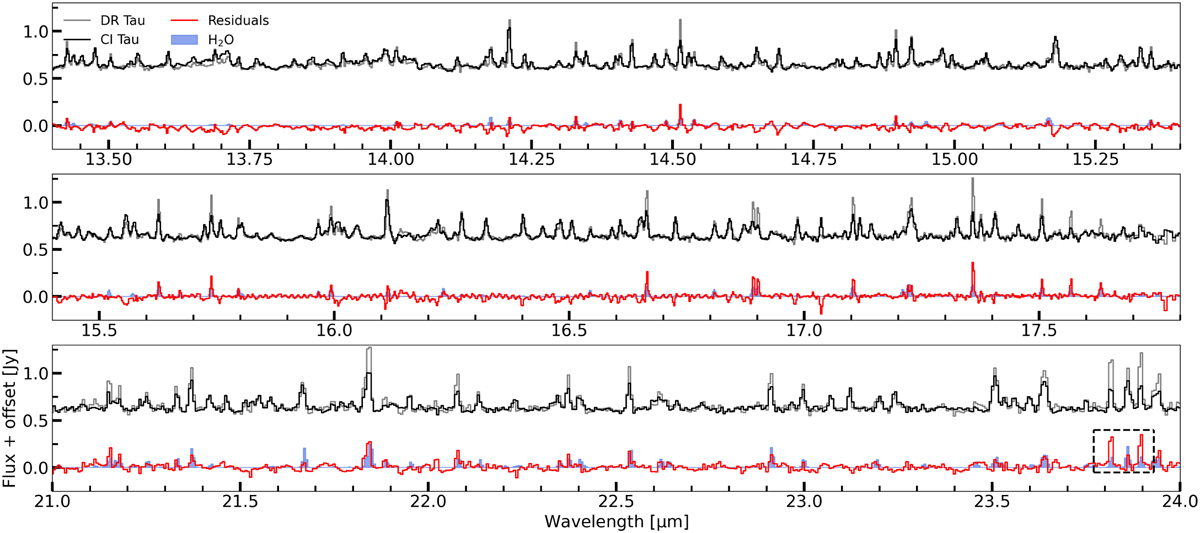
Spectra (across 13.4–24.0 μm) of DR Tau (grey) and CI Tau (black, scaled; see Sect. 3.2.2) shown together with the residual spectrum (in red) of DR Tau after subtraction of the scaled spectrum of CI Tau. The best fitting H2O slab model (T = 375 K) to the residuals is shown in blue. The black dashed box just shortward of ~24.0 μm indicates the pair of lines identified by Banzatti et al. (2023a), hinting at a third component (~170 K) needed to fully explain the observed H2O reservoir.
Current usage metrics show cumulative count of Article Views (full-text article views including HTML views, PDF and ePub downloads, according to the available data) and Abstracts Views on Vision4Press platform.
Data correspond to usage on the plateform after 2015. The current usage metrics is available 48-96 hours after online publication and is updated daily on week days.
Initial download of the metrics may take a while.