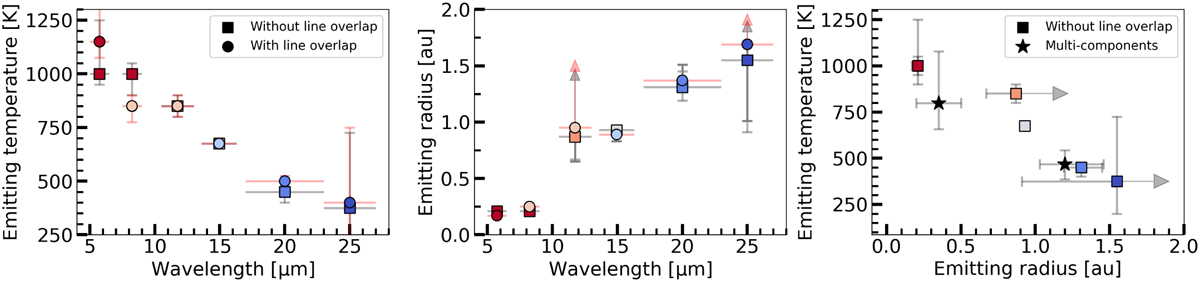
Fig. 3
Download original image
Inferred gas temperature (left) and emitting radii (middle) for the different wavelength regions, and the emitting temperature as a function of the emitting radius (right). We show the results for the slab model fits without (squares) and with (circles) line overlap. The colours indicate the varying gas temperatures, whereas the horizontal bars denote the wavelength ranges of the regions. Errorbars are shown for the derived quantities, where those for the models without line overlap are shown in black and those for the models with line overlap are shown in red. In addition, we show for comparison the results (blacks stars) of the three component fit (approach 3, see Sect. 3.3.3) in the right panel.
Current usage metrics show cumulative count of Article Views (full-text article views including HTML views, PDF and ePub downloads, according to the available data) and Abstracts Views on Vision4Press platform.
Data correspond to usage on the plateform after 2015. The current usage metrics is available 48-96 hours after online publication and is updated daily on week days.
Initial download of the metrics may take a while.