Fig. 1
Download original image
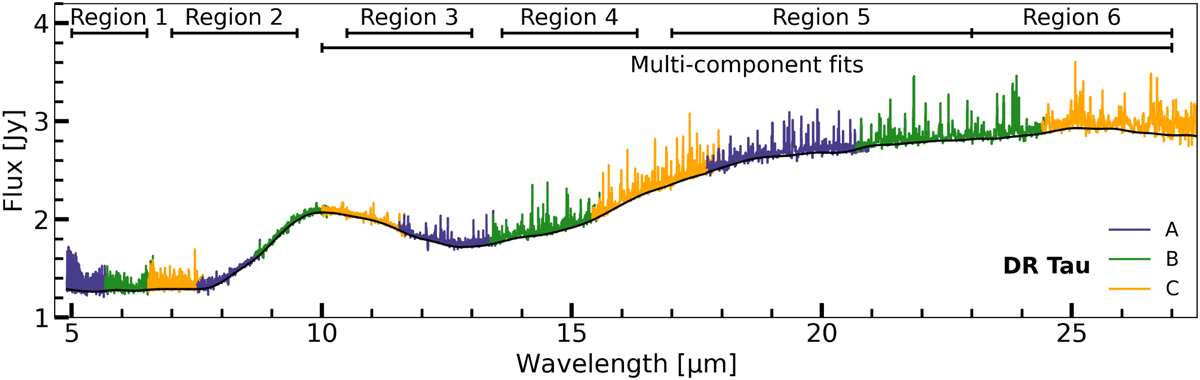
Full JWST-MIRI spectrum (4.9–27.5 μm) of DR Tau. The different wavelength ranges (subbands) of each MIRI/MRS channel are shown in blue (‘A’), green (‘B’), and orange (‘C’), respectively. The wavelength regions over which H2O will be analysed are indicated by the horizontal bars. The continuum fit is indicated by the black line.
Current usage metrics show cumulative count of Article Views (full-text article views including HTML views, PDF and ePub downloads, according to the available data) and Abstracts Views on Vision4Press platform.
Data correspond to usage on the plateform after 2015. The current usage metrics is available 48-96 hours after online publication and is updated daily on week days.
Initial download of the metrics may take a while.