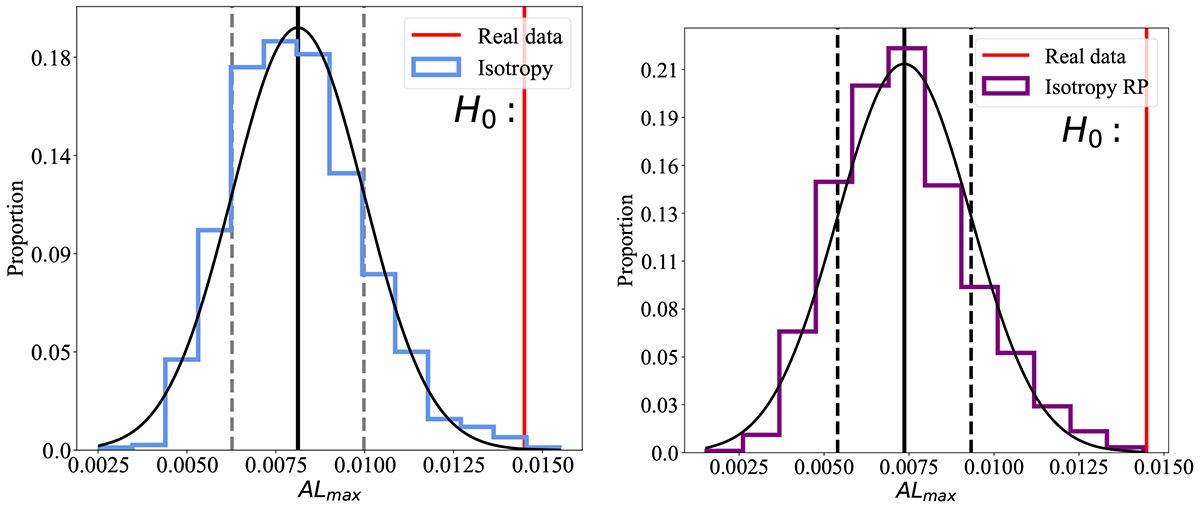
Fig. 8.
Download original image
Statistical results in 1000 simulated isotropic datasets. The blue and purple colors represent the statistical results of isotropic analyses (isotropy) and isotropic analyses that preserve the spatial inhomogeneity of real data (isotropy RP); that is, 3.42σ and 3.62σ, respectively. The black curve is the best-fitting result to the Gaussian function. The solid and vertical dashed black lines are commensurate with the mean and the standard deviation, respectively. The vertical red line shows the ALmax derived from the real data.
Current usage metrics show cumulative count of Article Views (full-text article views including HTML views, PDF and ePub downloads, according to the available data) and Abstracts Views on Vision4Press platform.
Data correspond to usage on the plateform after 2015. The current usage metrics is available 48-96 hours after online publication and is updated daily on week days.
Initial download of the metrics may take a while.