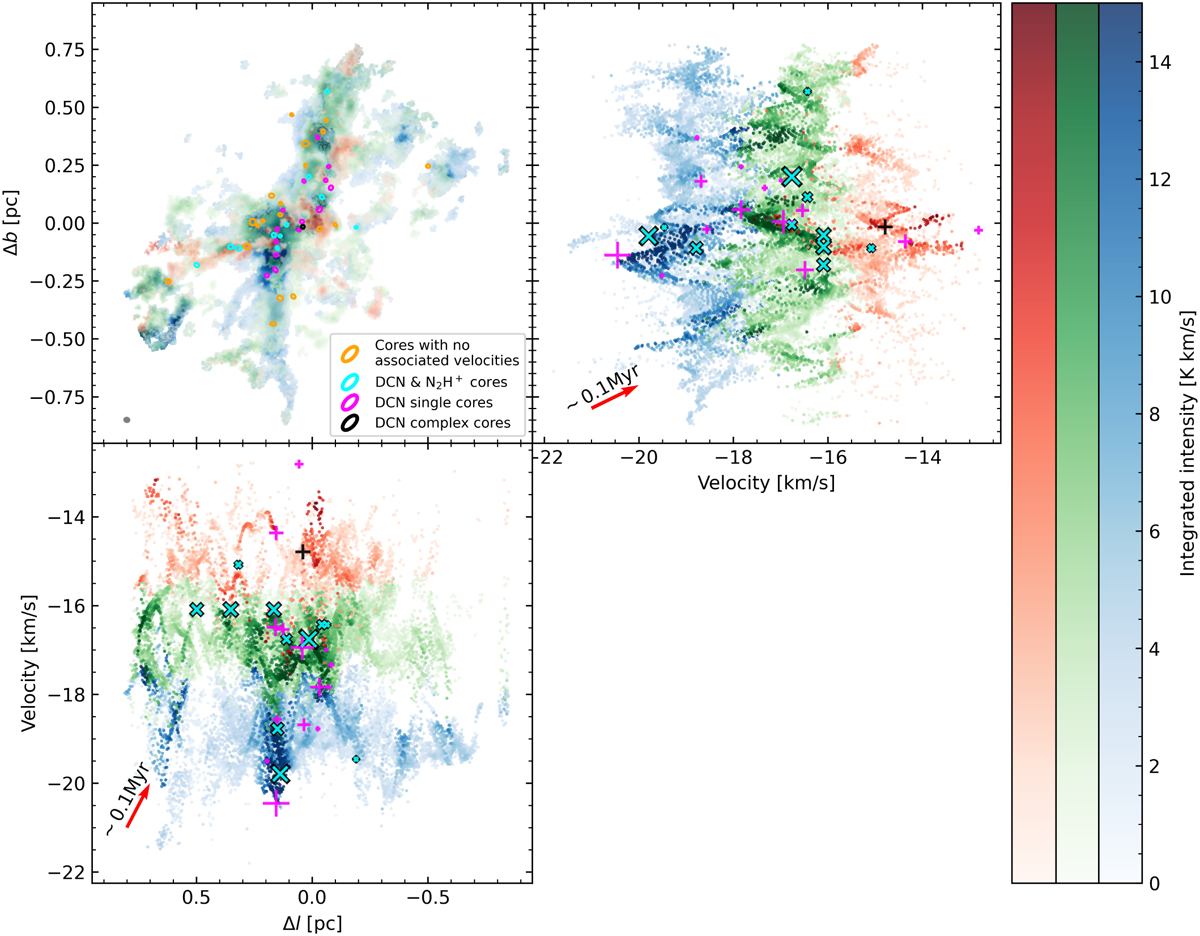
Fig. 9
Download original image
N2H+ intensity-weighted position-position and PV diagrams of G353. Top left: spatial distribution of the fitted N2H+ Gaussian isolated velocity components (blue, green, and red, see Sect. 4.1). Ellipses indicate the location of the 1.3 mm continuum cores (Louvet et al. 2024). Orange indicates cores with no DCN detections. Fuchsia and black represent cores with single and complex DCN velocities (Cunningham et al. 2023). DCN & N2H+ cores are indicated with cyan. We show the beam size with a gray ellipse in the bottom left corner. Top right and bottom left: intensity-weighted PV diagrams along the b and l coordinates, respectively. For the 1.3 mm core velocities we use the same colors and markers convention from Fig. 8. For reference we indicate with a red arrow, in both the top right and bottom left panels, a VG of 10 km s−1 pc−1 corresponding to a timescale of ~0.1 Myr. We see multiple V-shapes near the location of cores across all velocities in the PV diagrams, more prominently in the top right panel (see Fig. D.1). The most prominent V-shape is located in the blue component, at (V, ∆b) ~ (−20.5km s−1, −0.14 pc) (see Sect. 5.2). We provide an interactive 3D PPV diagram online.
Current usage metrics show cumulative count of Article Views (full-text article views including HTML views, PDF and ePub downloads, according to the available data) and Abstracts Views on Vision4Press platform.
Data correspond to usage on the plateform after 2015. The current usage metrics is available 48-96 hours after online publication and is updated daily on week days.
Initial download of the metrics may take a while.