Fig. 8
Download original image
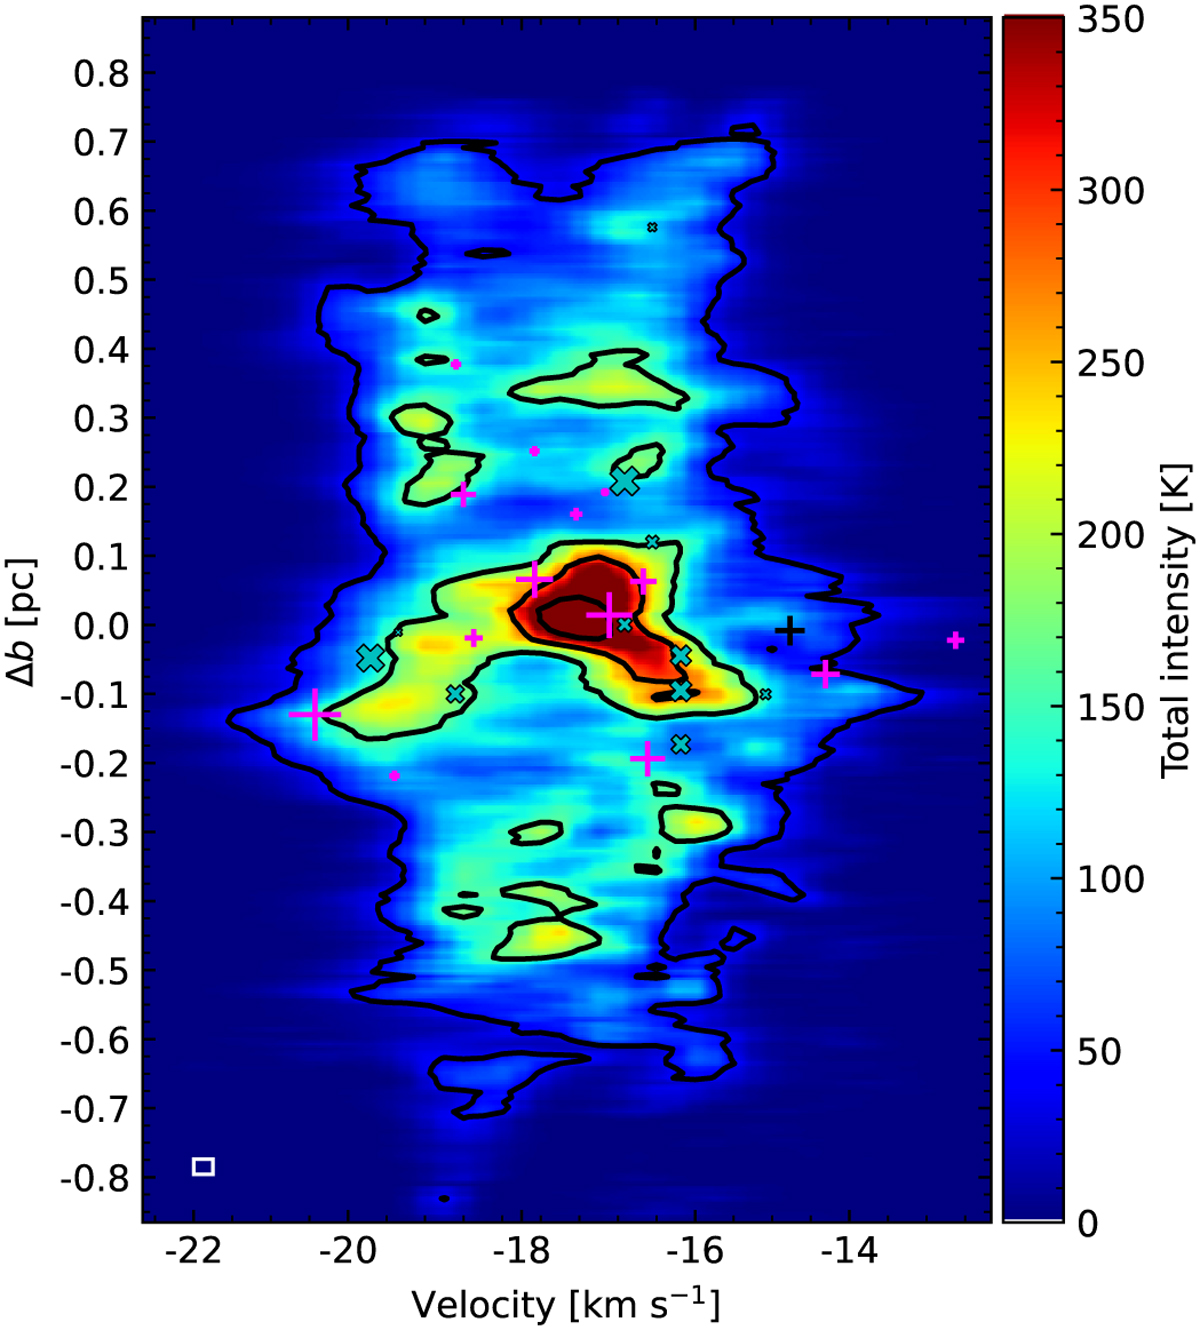
“Traditional” PV diagram of the N2H+ modeled isolated components, created by collapsing the l coordinate. Δb indicates the distance along b in pc, relative to the center of G353, assuming a distance of 2 kpc (Motte et al. 2022). The colormap indicates the total intensity along l. With fuchsia and black crosses we show the 1.3 mm cores with single and complex DCN velocities detections, respectively (Cunningham et al. 2023). With dark cyan “×” markers we show the 1.3 mm cores with velocities derived from DCN and N2H+ data (see Sect. 4.2). The size of the markers indicate relative mass (Louvet et al. 2024). Black contours indicate total intensities at 40, 160, 280, and 400 K. We see a large-scale velocity spread (ΔV ~ 8 km s−1) around Δb ~ −0.3 pc − 0.13 pc (see also Sect. 5.2). We show the major axis of the beam and the channel width with a white rectangle at the bottom left corner.
Current usage metrics show cumulative count of Article Views (full-text article views including HTML views, PDF and ePub downloads, according to the available data) and Abstracts Views on Vision4Press platform.
Data correspond to usage on the plateform after 2015. The current usage metrics is available 48-96 hours after online publication and is updated daily on week days.
Initial download of the metrics may take a while.