Fig. 3
Download original image
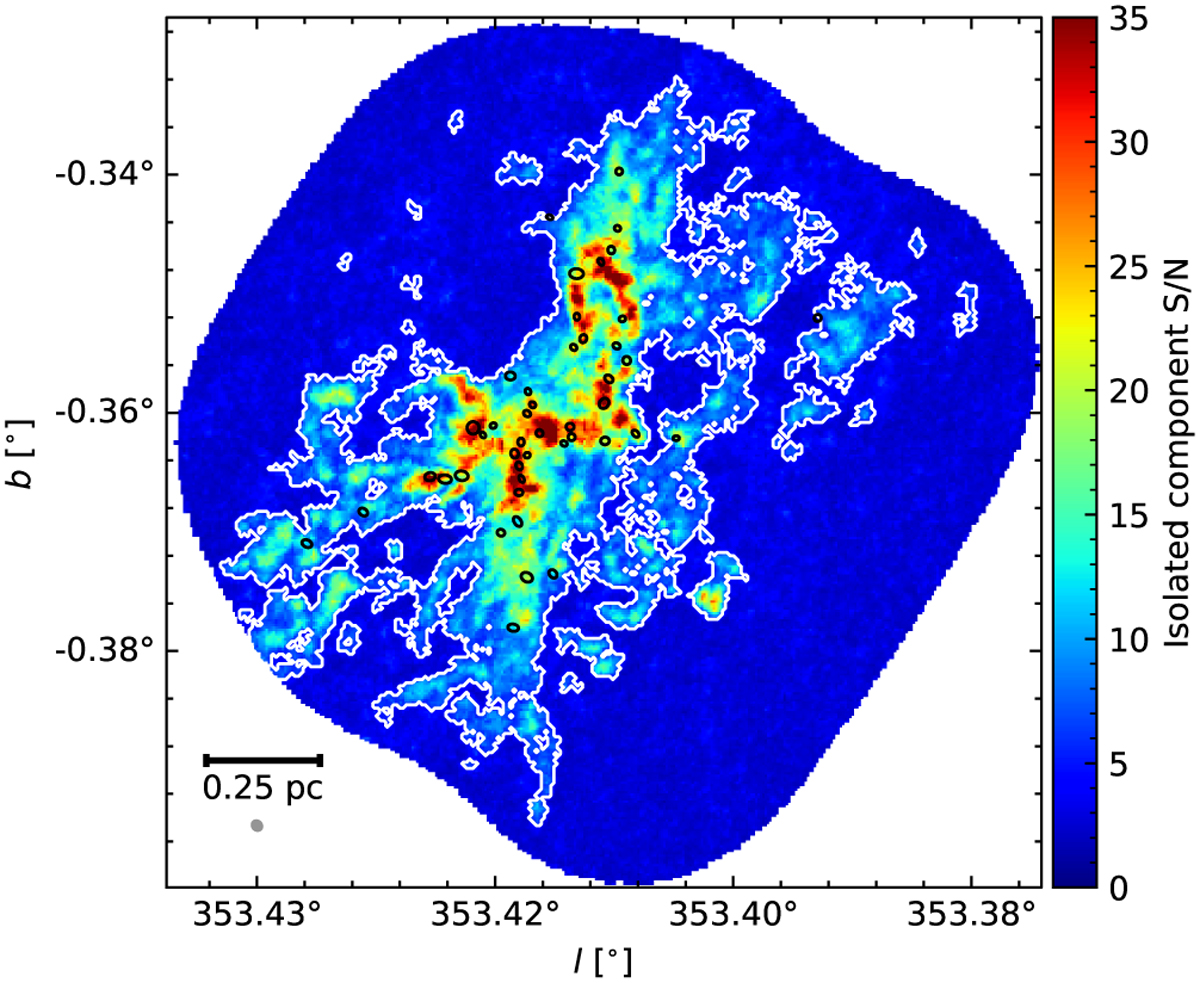
G353 N2H+ isolated component S/N map. The white contour indicates the location of data with an isolated component S/N ≥ 5. We show the location of the 1.3 mm cores presented in Louvet et al. (2024) with black ellipses and are located in regions with S/N ≥ 15. We indicate the beam size of these data with a gray ellipse at the bottom left corner. Outside the S/N contour we make a rough extraction of the isolated component (see text). For data inside the S/N contours, we implement a procedure based on detection of peaks and valleys, to individually extract high (≥5) S/N isolated components (see Sect. 3).
Current usage metrics show cumulative count of Article Views (full-text article views including HTML views, PDF and ePub downloads, according to the available data) and Abstracts Views on Vision4Press platform.
Data correspond to usage on the plateform after 2015. The current usage metrics is available 48-96 hours after online publication and is updated daily on week days.
Initial download of the metrics may take a while.