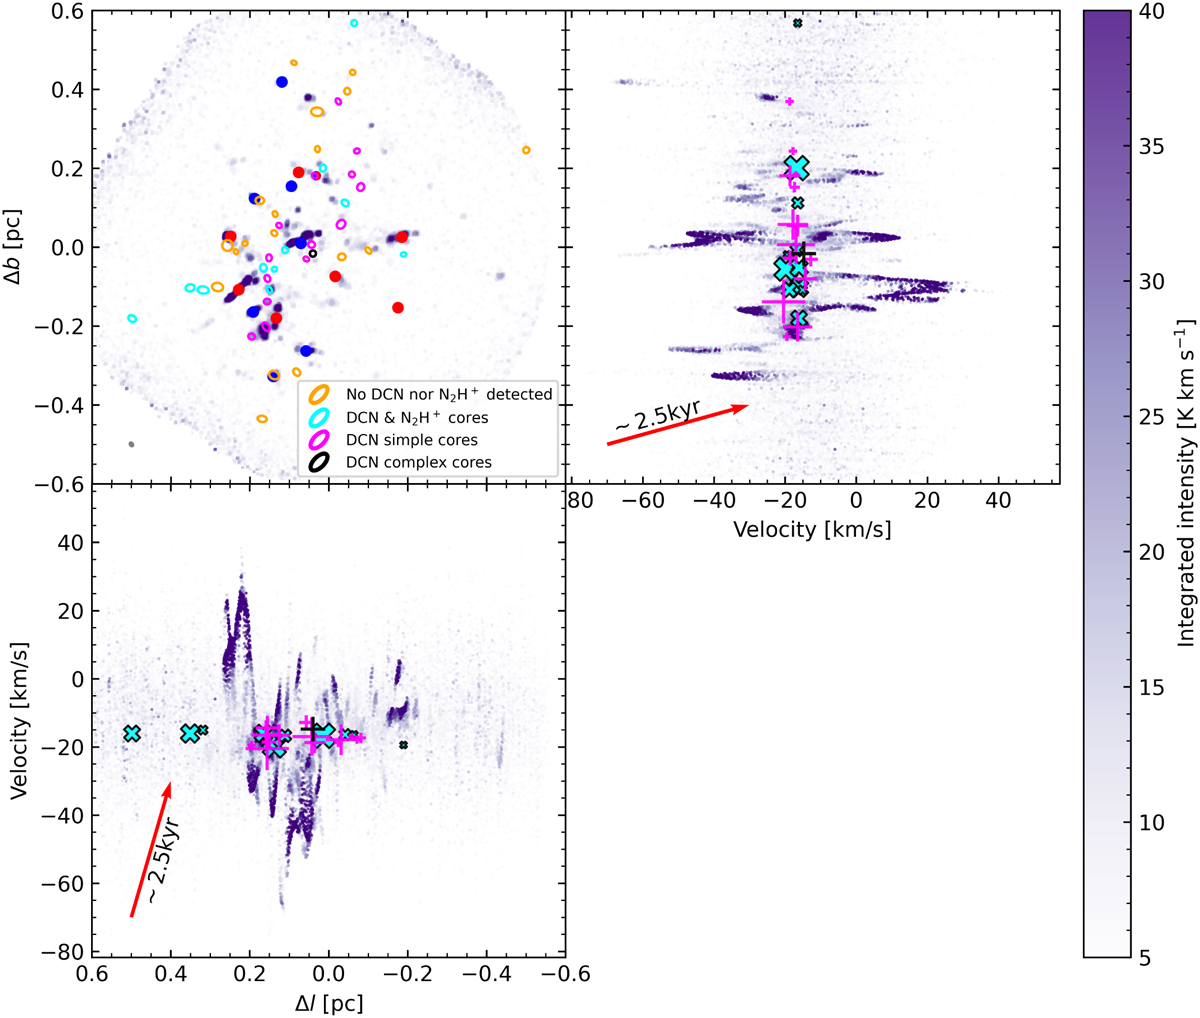
Fig. E.1

Download original image
ALMA-IMF 12 m SiO equivalent of Fig. 9 using data from Cunningham et al. (2023). For the cores, we use the same marker and color convention from Fig. 9. With filled blue, red, and ‘red+blue’ circles we represent the SiO outflow candidates (Towner et al. 2024). With red arrows we indicate a VG = 400 km s–1 pc–1 corresponding to a timescale tVG = 2.5 kyr. The velocity range (∆V) covered by the SiO emission is ~80km s–1, about 10 times the velocity range traced by N2H+. This velocity difference suggests that SiO is tracing processes (outflows) ~100 times more energetic (ek = ∆V/2) than N2H+ (possibly infall).
Current usage metrics show cumulative count of Article Views (full-text article views including HTML views, PDF and ePub downloads, according to the available data) and Abstracts Views on Vision4Press platform.
Data correspond to usage on the plateform after 2015. The current usage metrics is available 48-96 hours after online publication and is updated daily on week days.
Initial download of the metrics may take a while.


