Fig. 2
Download original image
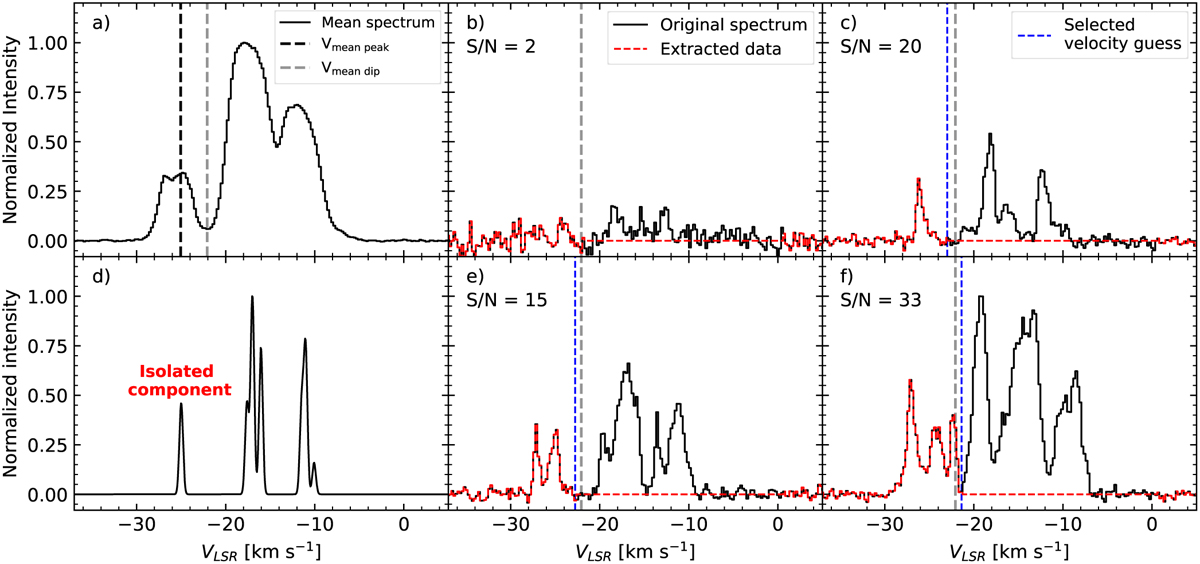
N2H+ spectra involved in our isolated component extraction procedure. Panel a: normalized average N2H+ spectrum (solid black line) over the entire region. We show the location of the mean peak of the isolated component (dashed black line) and the “mean dip” (dashed gray line), see text. Middle and right panels: normalized example spectra (within a pixel) of the N2H+ isolated velocity component extraction procedure (see Sect. 3). We show G353 N2H+ spectra with solid black lines and the extracted isolated component, along with emission-free channels, with dashed red lines. Panel d: expected N2H+ emission for an excitation temperature of 15 K, an opacity of 1, velocity centroid of −17 km s−1, and a line width of 0.2 km s−1. We see the seven hyperfine components characteristic of this tracer, in which the most blueshifted corresponds to the isolated component. To derive this emission we use “n2hp_vtau” model from PySpecKit. In panels b, c, e, and f) we indicate Vmean dip with a dashed gray line. We present data with S /N < 5 in panel b, in which we make a rough extraction based on the Vmean dip. We show data with S /N ≥ 5 in panels c, e, and f, presenting clear single, double, and triple N2H+ isolated velocity components, respectively. In these examples we represent the selected velocity guess that separates the isolated component emission from the main line emission with dashed blue lines. The offset positions (Δl, Δb) of the spectra in panels b, c, e, and f are (0.68 pc, 0.27 pc), (0.12pc, −0.28 pc), (−0.08 pc, 0.47 pc), and (0.16pc, −0.07pc), respectively. These offsets are estimated relative to the center of the region (see Sect. 1).
Current usage metrics show cumulative count of Article Views (full-text article views including HTML views, PDF and ePub downloads, according to the available data) and Abstracts Views on Vision4Press platform.
Data correspond to usage on the plateform after 2015. The current usage metrics is available 48-96 hours after online publication and is updated daily on week days.
Initial download of the metrics may take a while.