Fig. D.1
Download original image
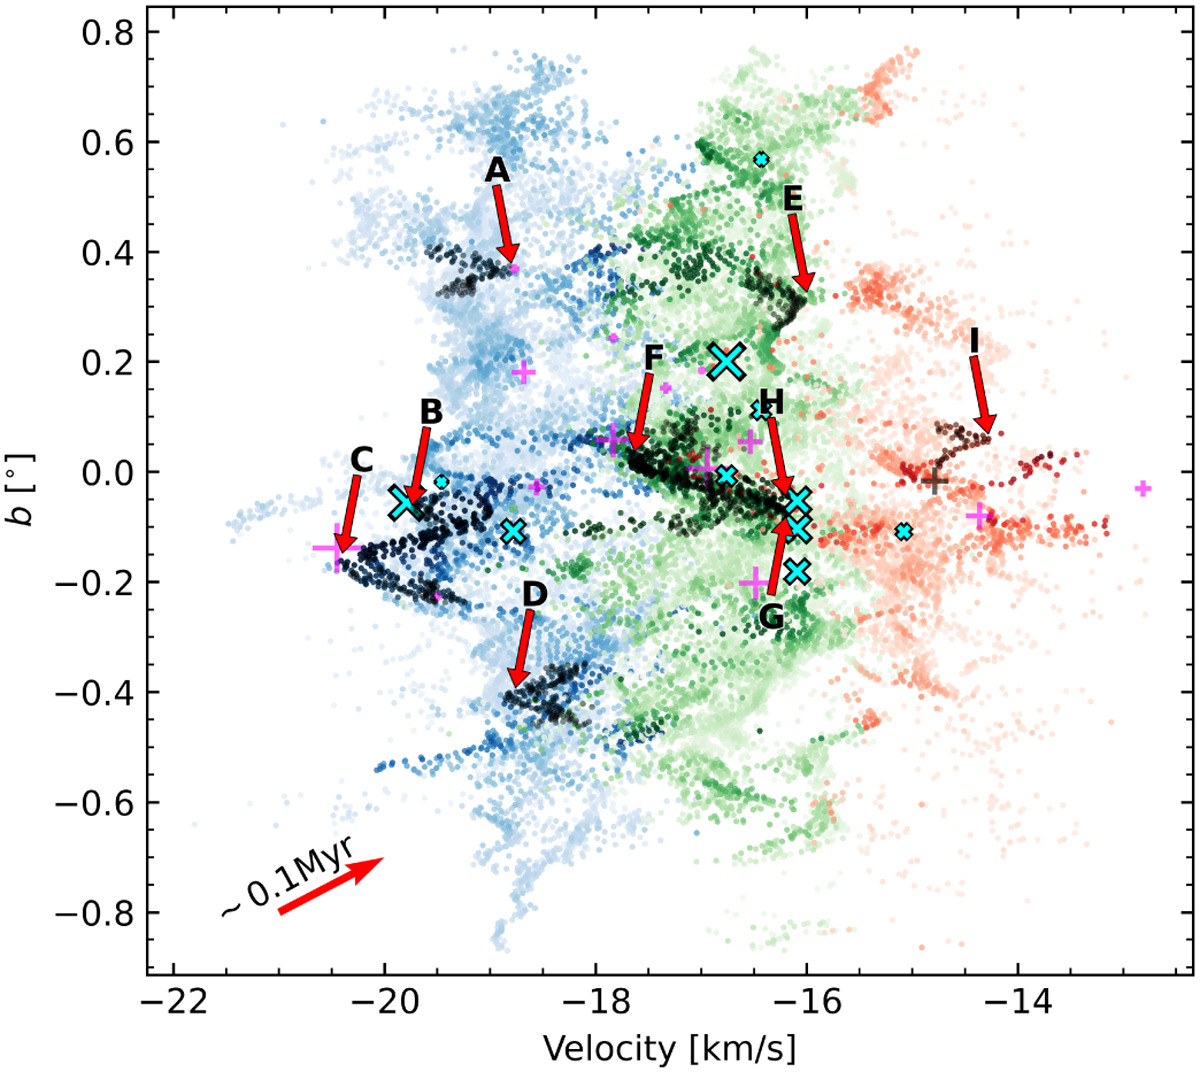
V-shapes location in PV space. We highlight the V-shapes listed in Table D.1 with black points and indicate them with red arrows and their ID. The core velocities and the N2H+ velocity distributions follow the same definitions from the top right panel in Fig. 9. V-shapes G and H overlap in PV space but these structures are spatially separated (left panel).
Current usage metrics show cumulative count of Article Views (full-text article views including HTML views, PDF and ePub downloads, according to the available data) and Abstracts Views on Vision4Press platform.
Data correspond to usage on the plateform after 2015. The current usage metrics is available 48-96 hours after online publication and is updated daily on week days.
Initial download of the metrics may take a while.