Fig. C.1
Download original image
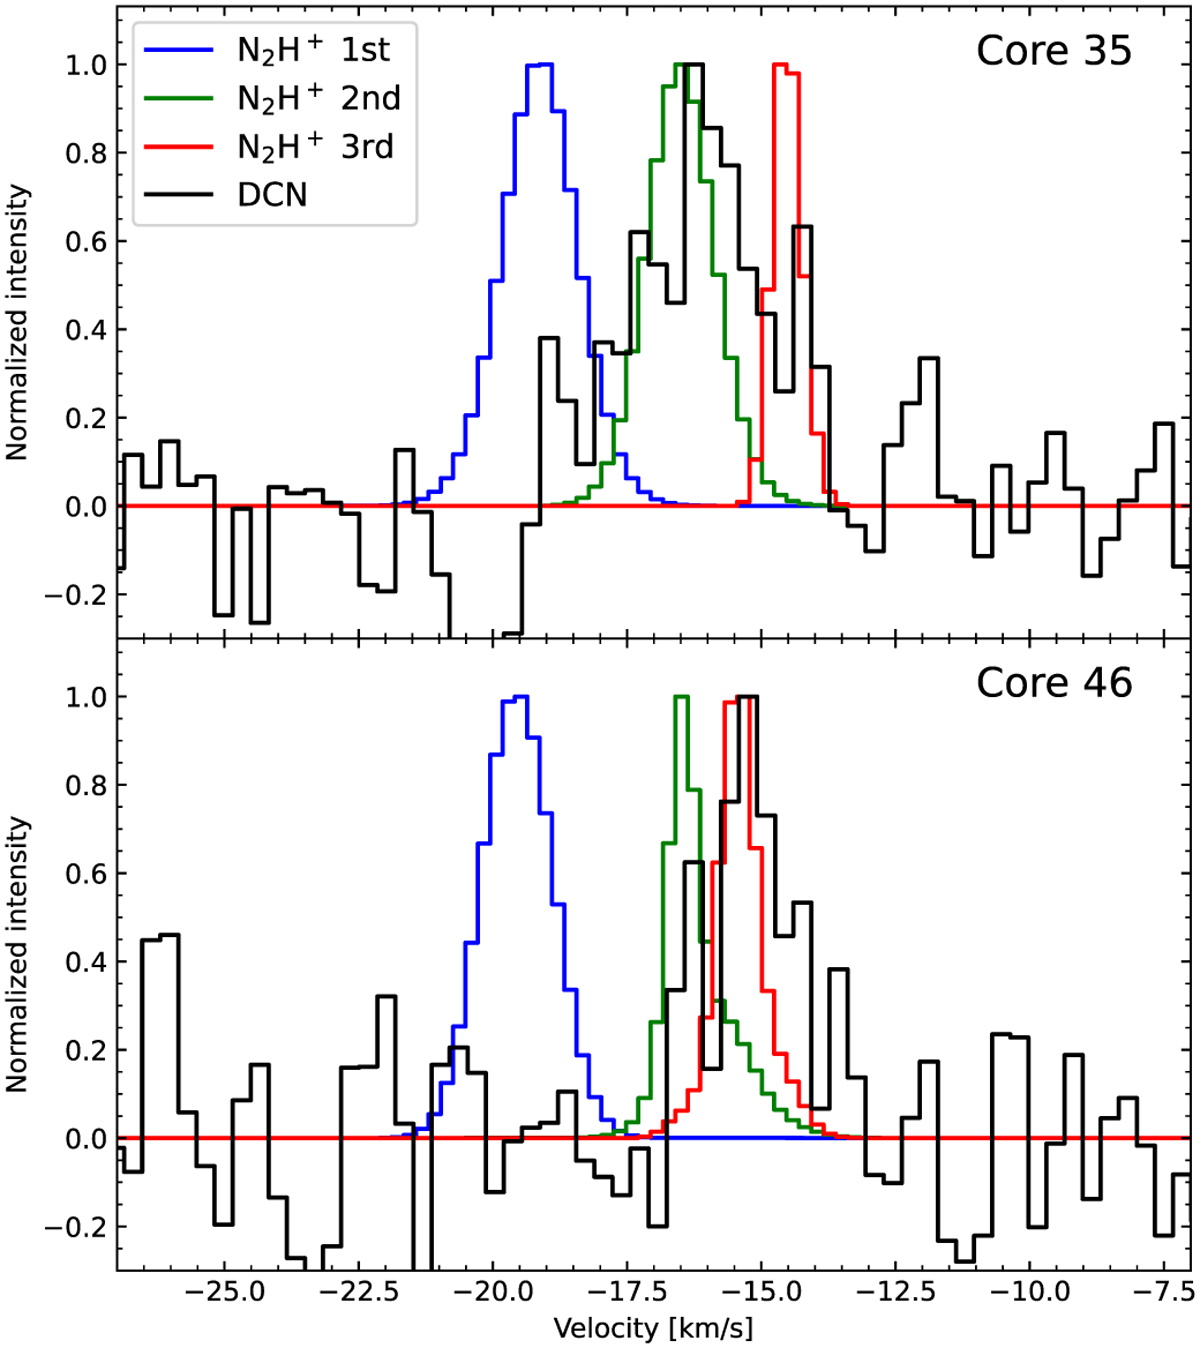
DCN and N2H+ normalized mean spectrum of cores 35 (top) and 46 (bottom). We show the multiple N2H+ isolated velocity components with blue, red, and green colors. We present the DCN emission in black. We see a match between the DCN emission and one of the N2H+ velocity components. We determine the N2H+ velocity for 11 cores with no DCN velocity fits. These are listed in Table C.1.
Current usage metrics show cumulative count of Article Views (full-text article views including HTML views, PDF and ePub downloads, according to the available data) and Abstracts Views on Vision4Press platform.
Data correspond to usage on the plateform after 2015. The current usage metrics is available 48-96 hours after online publication and is updated daily on week days.
Initial download of the metrics may take a while.