Fig. B.1
Download original image
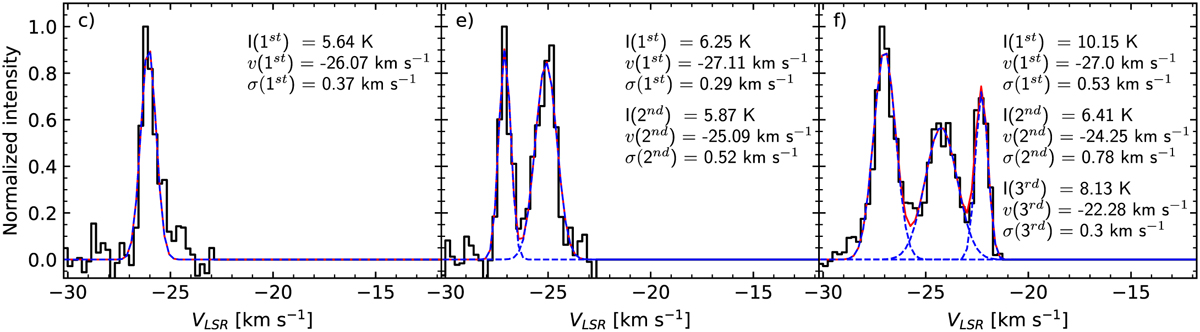
Gaussian velocity fits of the extracted N2H+ isolated components. In black we show the high S/N isolated components from panels c), e), and f) in Fig. 2. The individual Gaussian components and the obtained model are represented with dashed blue and solid red lines, respectively. On the right side of each panel we indicate the peak intensity (I), the velocity centroid (v), and velocity dispersion (σ) of each Gaussian component. The notations 1st, 2nd, and 3rd indicate the Gaussian velocity components from left to right.
Current usage metrics show cumulative count of Article Views (full-text article views including HTML views, PDF and ePub downloads, according to the available data) and Abstracts Views on Vision4Press platform.
Data correspond to usage on the plateform after 2015. The current usage metrics is available 48-96 hours after online publication and is updated daily on week days.
Initial download of the metrics may take a while.