Open Access
Fig. 14
Download original image
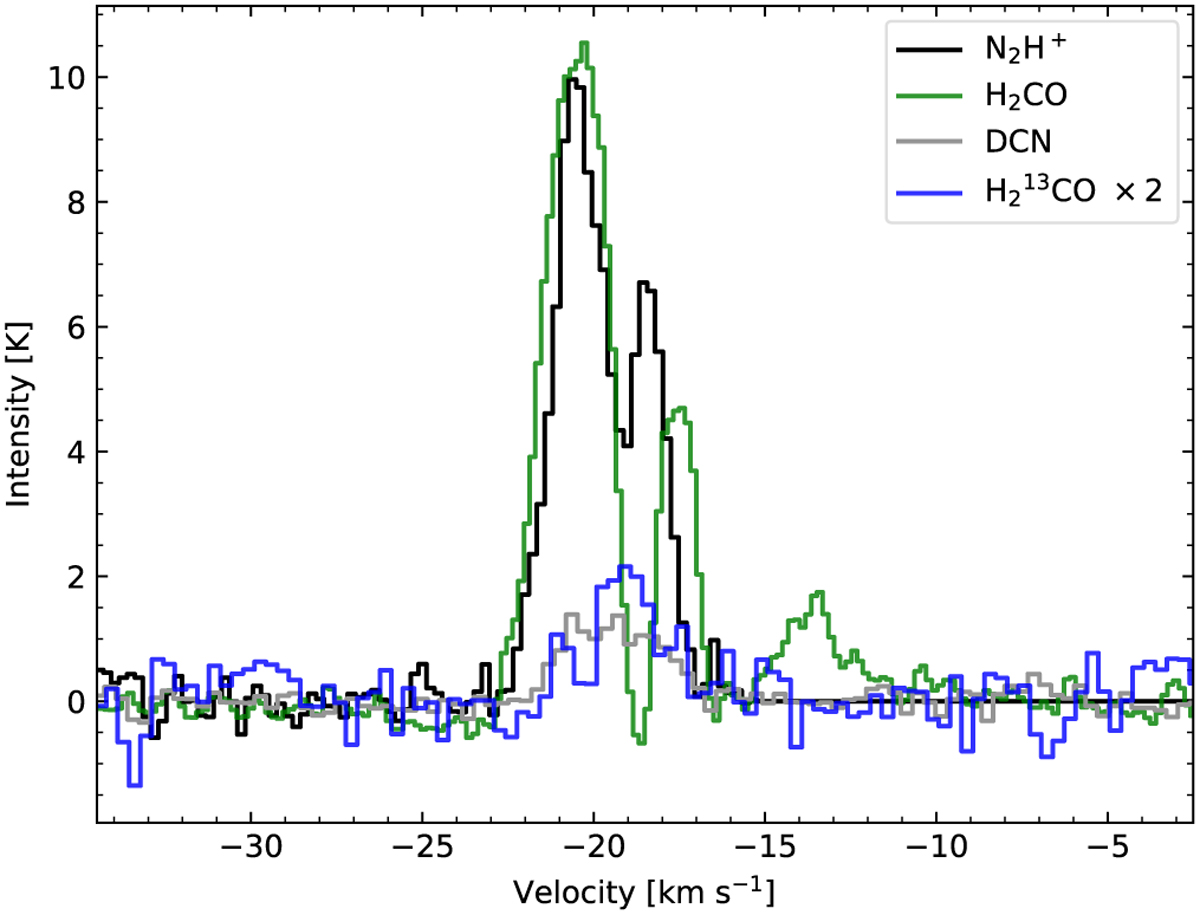
Mean spectra within a 1.14″ (~0.01 pc) radius around the location of the main blue V-shape (pink “×” in Fig. 12). Both N2H+ and H2CO show blue asymmetry, known to characterize infall motions. The difference in velocity between the two N2H+ peaks is ~2.5 km s−1.
Current usage metrics show cumulative count of Article Views (full-text article views including HTML views, PDF and ePub downloads, according to the available data) and Abstracts Views on Vision4Press platform.
Data correspond to usage on the plateform after 2015. The current usage metrics is available 48-96 hours after online publication and is updated daily on week days.
Initial download of the metrics may take a while.