Fig. 12
Download original image
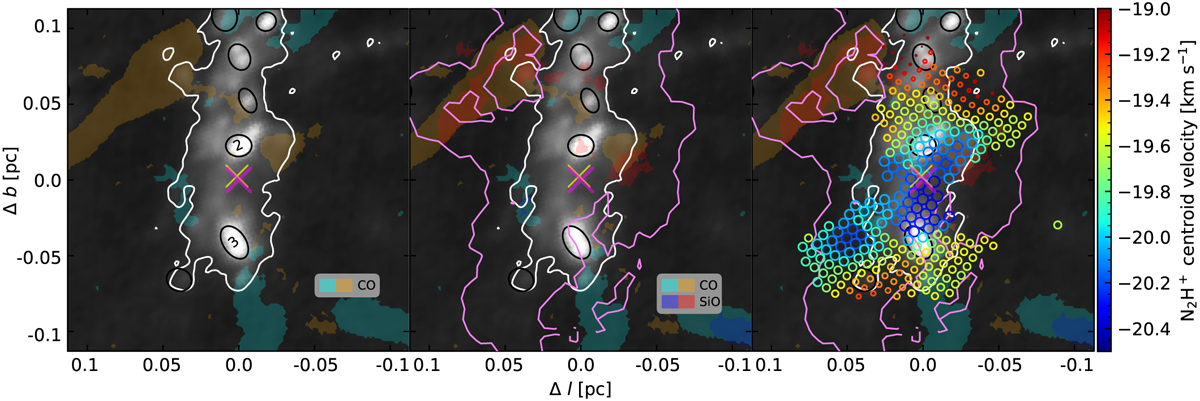
Multi-tracer diagram at the location of the main blue V-shape of G353 (Sect. 5.3). The different panels show the step by step construction of the final plot (right panel). Left panel: the black to white background shows the 1.3 mm continuum emission from Díaz-González et al. (2023). With black ellipses we show the 1.3 mm continuum cores from Louvet et al. (2024). With black text we indicate the IDs of the cores closest to the center of the V-shape, marked with a fuchsia “×”. We indicate the barycenter of cores 2 & 3 (see Fig. 11) with a yellow “×”. Filled contours represent the CO (2–1) emission in the velocity ranges of −50 km s−1 to −15 km s−1 (cyan) and 15 km s−1 to 50 km s−1 (beige), relative to the Vlsr = −17 km s−1 of G353. With a white contour we indicate the log (N(H2) cm2) = 23.3. Middle panel: in addition to the left panel, we include the SiO (5–4) emission with blue and red contours in the same (negative and positive) velocity range as with CO. The pink contour indicates the integrated intensity of the most blueshifted modeled N2H+ Gaussian velocity component (see Fig. 9; blue distribution), at a value of 7 K km s−1. Right panel: with open circles we show the location of the data composing the main N2H+ blue V-shape. The colors indicate their velocity centroid, and their (increasing) size indicates how close the gas velocities are to the velocity apex of the V-shape. This VG seems to converge to the barycenter of cores 2 and 3, and it is oriented along filament “F3”.
Current usage metrics show cumulative count of Article Views (full-text article views including HTML views, PDF and ePub downloads, according to the available data) and Abstracts Views on Vision4Press platform.
Data correspond to usage on the plateform after 2015. The current usage metrics is available 48-96 hours after online publication and is updated daily on week days.
Initial download of the metrics may take a while.