Fig. 11
Download original image
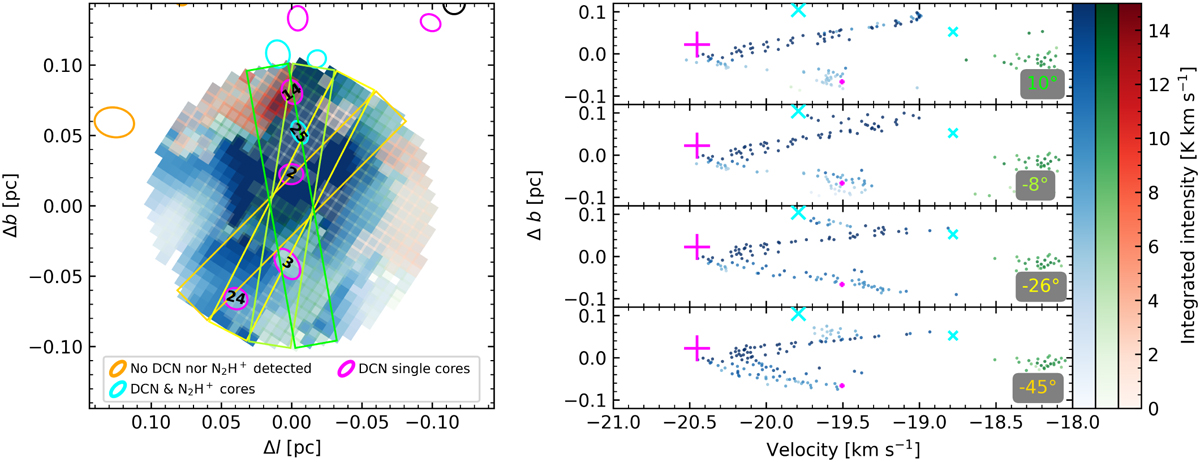
Left panel: integrated intensity map of the modeled N2H+ isolated component within a region of radius of 0.1 pc, centered at V-shape “C”. With boxes in shades of green and yellow, we indicate the different paths taken to create the PV diagrams shown on the right panel. The area covered by these four PVs matches the extent of this V-shape (see Fig. 12). The 1.3 mm cores are indicated using the same convention from Fig. 9. For the cores within the radius of 0.1 pc we indicate their IDs in black. Right panel: PV diagrams associated with the colored rectangles in the left panel. At the bottom right corner of each sub panel, with colored values, we indicate the angle (counter-clockwise) of each PV path. The PV paths match the V-shape coverage (right panel of Fig. 12). We see the overall structure of this V-shape persists at different angles, indicating that these structures are not a result of projection in the POS.
Current usage metrics show cumulative count of Article Views (full-text article views including HTML views, PDF and ePub downloads, according to the available data) and Abstracts Views on Vision4Press platform.
Data correspond to usage on the plateform after 2015. The current usage metrics is available 48-96 hours after online publication and is updated daily on week days.
Initial download of the metrics may take a while.