Fig. 10
Download original image
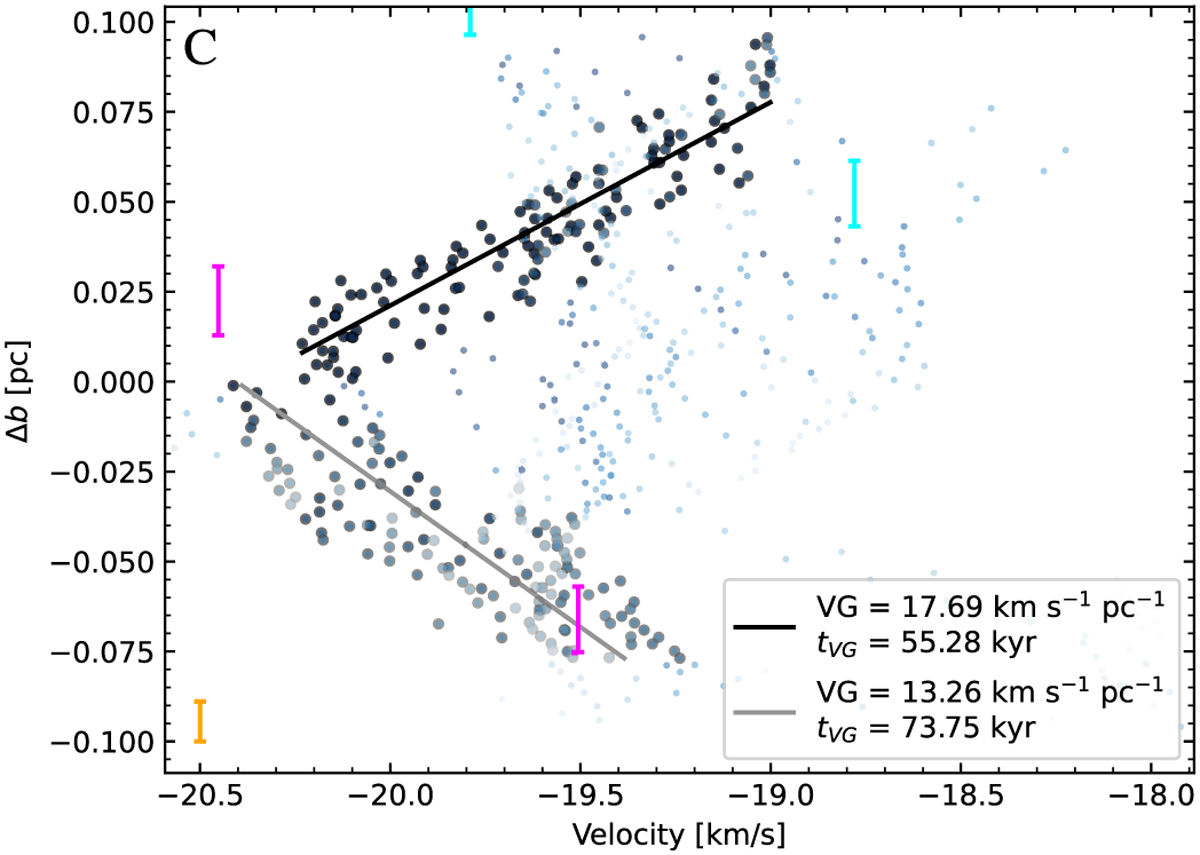
Zoomed-in version of the top right panel of Fig. 9, centered at the prominent blue V-shape (“C”) located at (∆b, V) = (−0.14pc, −20.5 km s−1). We indicate the major axis of the cores with vertical lines in fuchsia (DCN single) and cyan (N2H+), similarly we represent the major axis of the beam with a vertical orange line. We apply linear fits to the upper and lower distributions, represented by darker points. These points are selected based on an integrated intensity threshold (see Sect. 5.3). We weight each point by their integrated intensity and derive VGs from the slope of these linear fits. The range of the obtained VGs is ~13 – 18 km s−1 pc−1. We defined the timescale associated with the VG as tVG = VG−1, being in the range of ~50–70 kyr. We show eight more well characterized V-shapes in Appendix D.
Current usage metrics show cumulative count of Article Views (full-text article views including HTML views, PDF and ePub downloads, according to the available data) and Abstracts Views on Vision4Press platform.
Data correspond to usage on the plateform after 2015. The current usage metrics is available 48-96 hours after online publication and is updated daily on week days.
Initial download of the metrics may take a while.