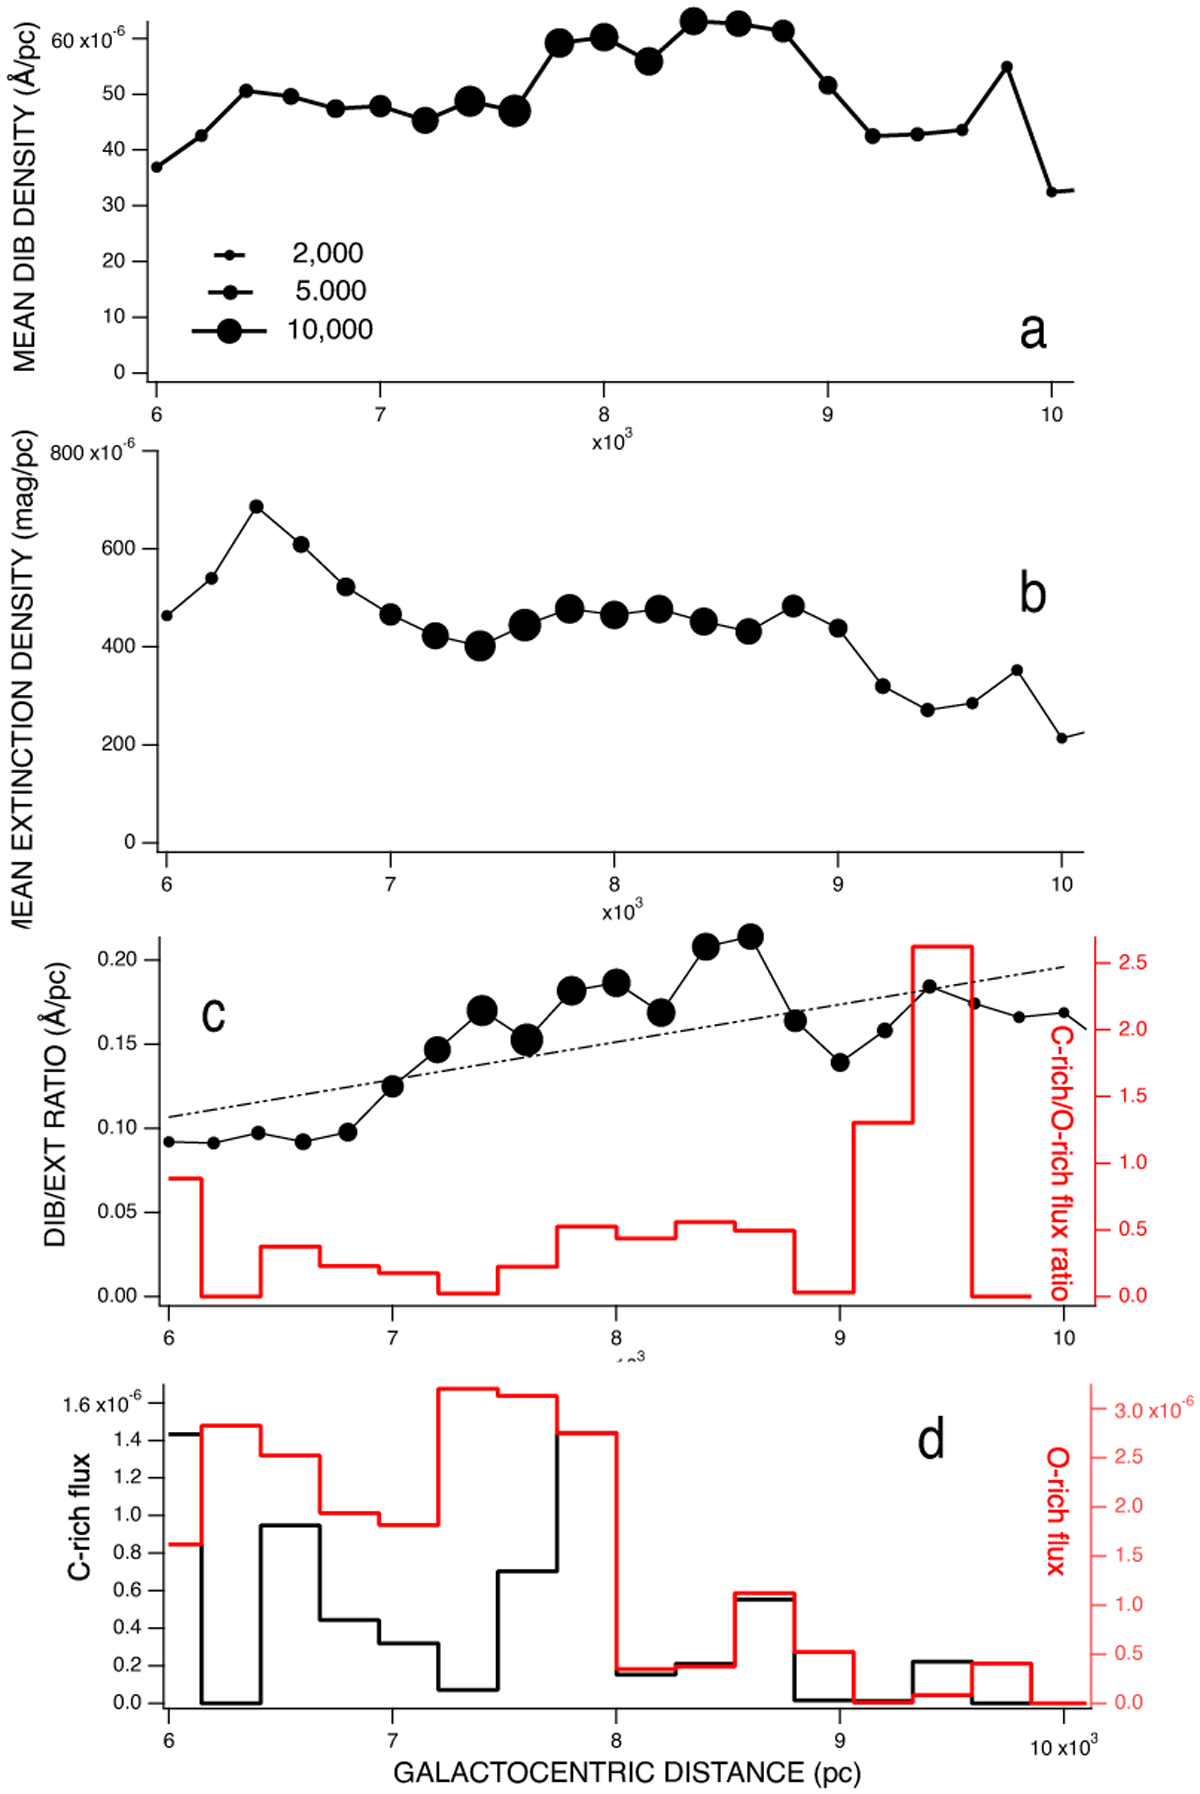
Fig. 9
Download original image
Average values of DIB (a) and extinction (b) volume density in 100 pc thick cylindric shells for varying galactocentric distances, and their ratio (c). All cells of the 3D maps were averaged except for low density targets (back contour in Fig. 1. The size of the markers is increasing with the number of targets located in the shell. The correspondence between the size and this number is illustrated in the top graph. A linear fit to the ratio is drawn in panel c. Also shown in c is the ratio between C-rich and O-rich total fluxes from AGBs located in 265 pc thick cylindric shells, computed based on the catalog of Scicluna et al. (2022). The corresponding C- and O-rich total fluxes are displayed in panel d.
Current usage metrics show cumulative count of Article Views (full-text article views including HTML views, PDF and ePub downloads, according to the available data) and Abstracts Views on Vision4Press platform.
Data correspond to usage on the plateform after 2015. The current usage metrics is available 48-96 hours after online publication and is updated daily on week days.
Initial download of the metrics may take a while.