Open Access
Fig. 1
Download original image
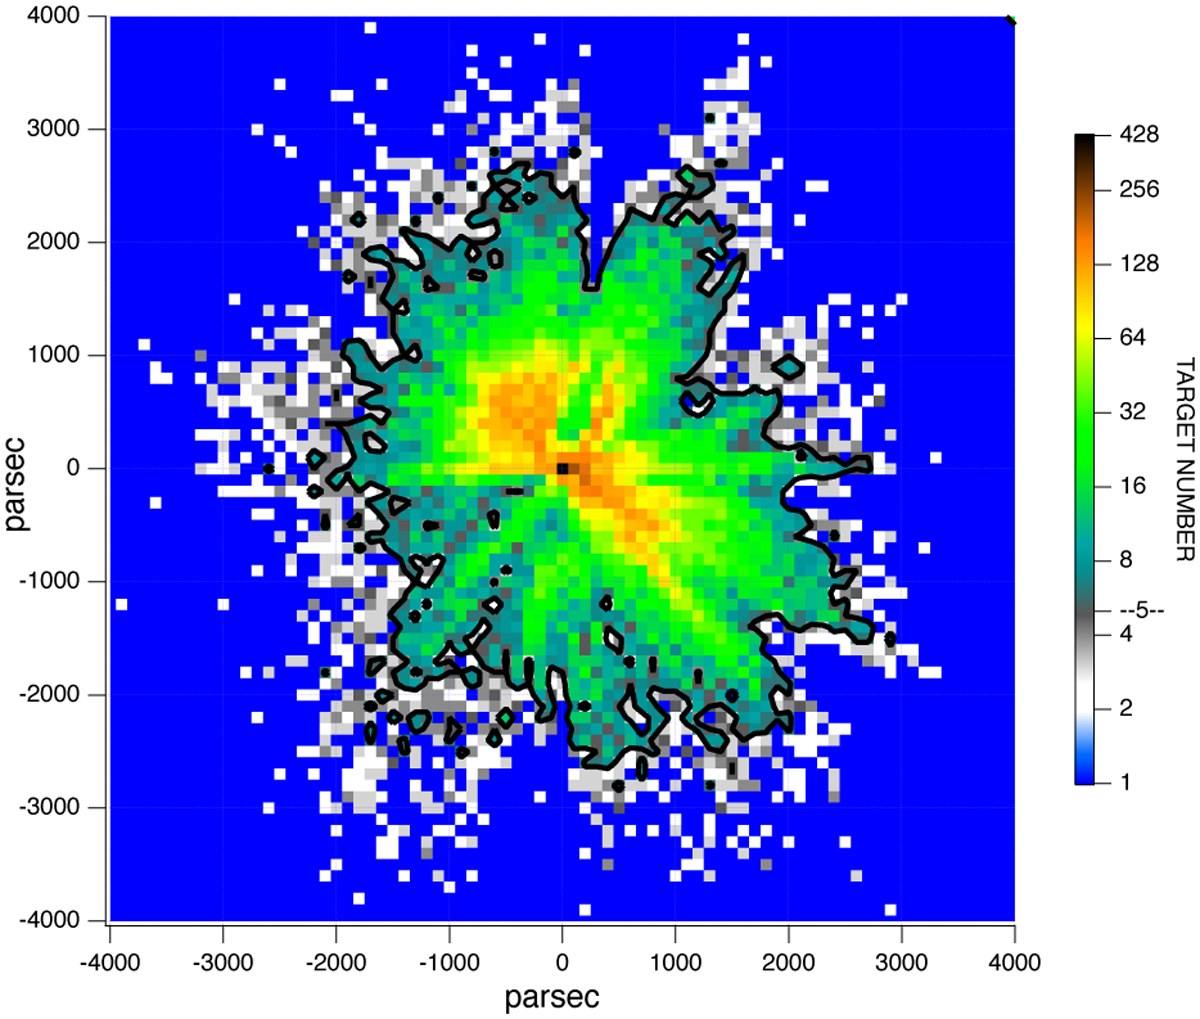
Coverage of sources in the input catalog along the Galactic plane. The number of sources per 1003 pc3 cell is color-coded. All sources with abs(z) <50 pc are included. The limit of five targets per cell used in the statistical study is marked by a thick black line.
Current usage metrics show cumulative count of Article Views (full-text article views including HTML views, PDF and ePub downloads, according to the available data) and Abstracts Views on Vision4Press platform.
Data correspond to usage on the plateform after 2015. The current usage metrics is available 48-96 hours after online publication and is updated daily on week days.
Initial download of the metrics may take a while.