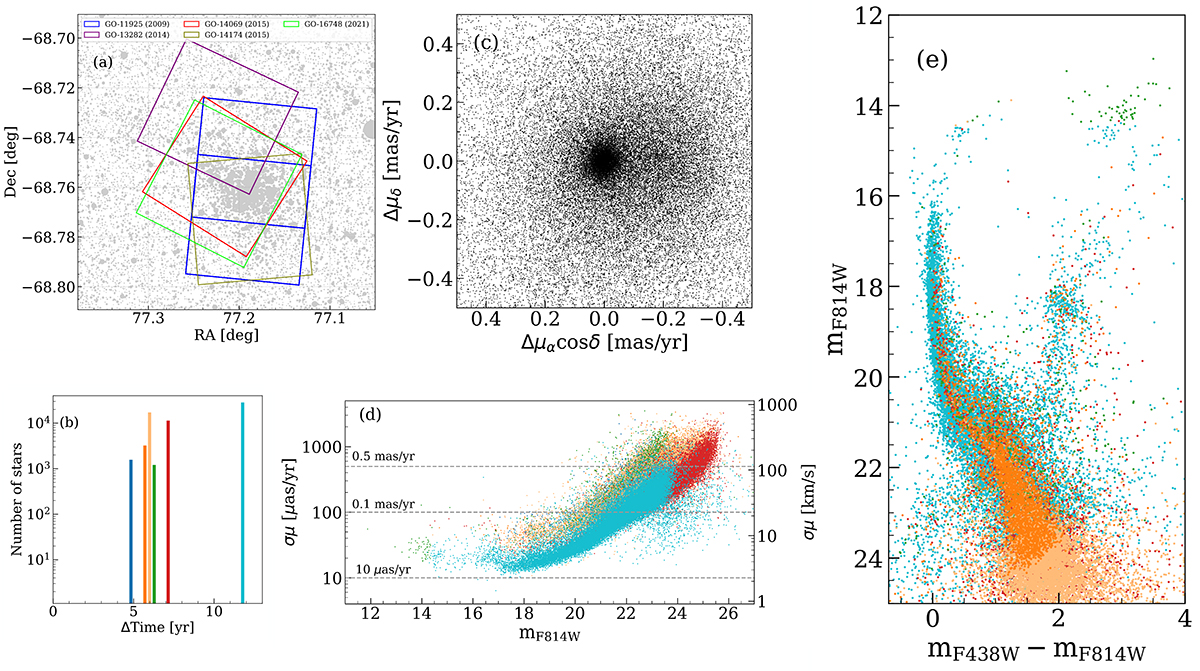
Fig. 8.
Download original image
Outline of the measured PMs towards NGC 1850. (a) Sketch of HST footprints from different epochs used for the calculation of the PMs. (b) Histogram of the time baselines available for the PM calculations of each source. The range in time baselines is mainly due to the varying overlap of the observations from different epochs. Sources shown in panels (d) and (e) are colour-coded according to the time baselines shown here. (c) VPD of a posteriori corrected, relative PMs. Member stars of NGC 1850 are clustered around (0.0, 0.0). (d) Corrected 1D PM errors as a function of the mF814W magnitude. Bright well-measured stars reach a precision of ∼15 μas yr−1 (corresponding to ∼3.3 km s−1 assuming a distance of 47.4 kpc). (e) mF814W vs. mF438W − mF814W CMD of all sources with measured PMs.
Current usage metrics show cumulative count of Article Views (full-text article views including HTML views, PDF and ePub downloads, according to the available data) and Abstracts Views on Vision4Press platform.
Data correspond to usage on the plateform after 2015. The current usage metrics is available 48-96 hours after online publication and is updated daily on week days.
Initial download of the metrics may take a while.