Fig. 5.
Download original image
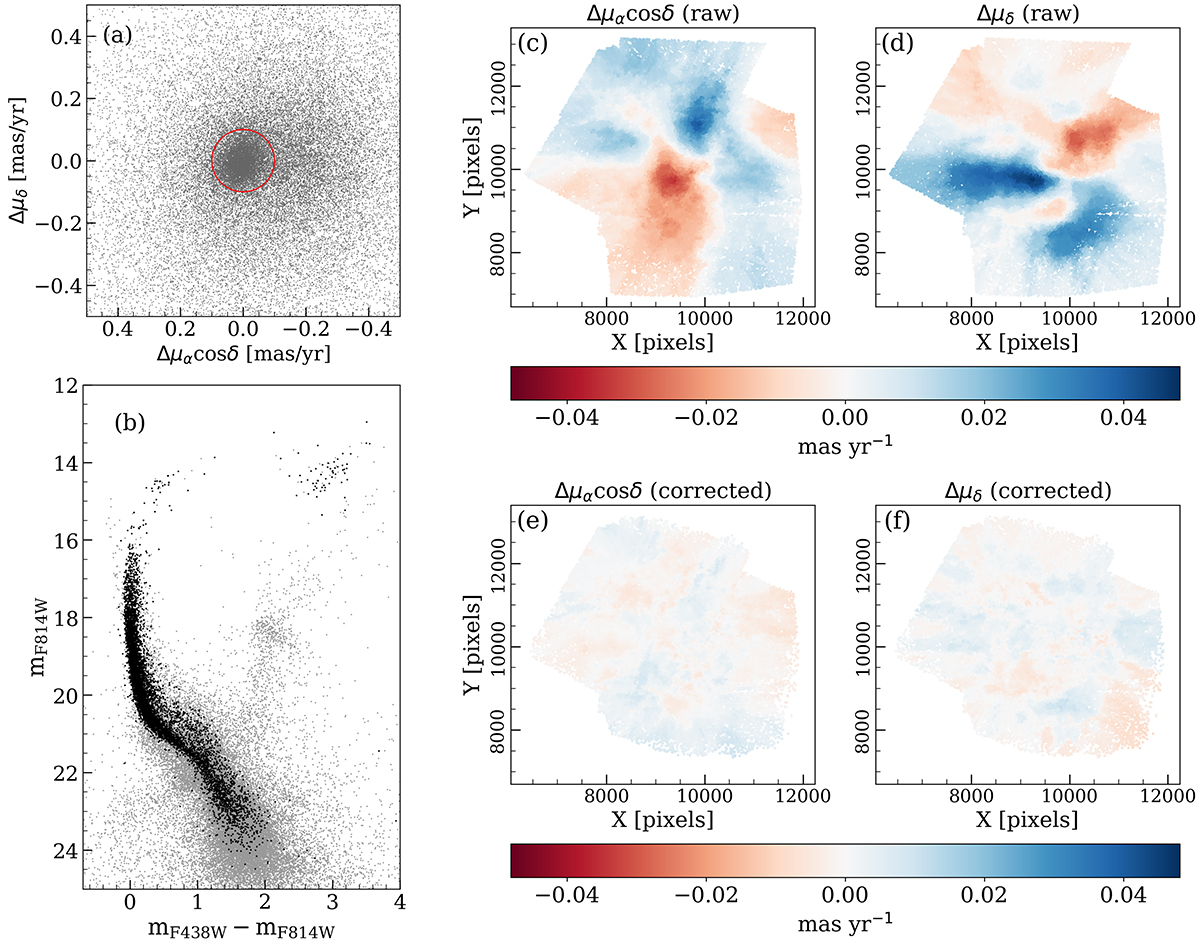
Outline of the procedure to correct the PMs for high-frequency systematic effects. Panel (a) shows the VPD of sources towards NGC 1850. Likely cluster members were selected based on their PMs (within the red circle, which has a radius of 0.1 mas yr−1 in the case of NGC 1850) and their positions in the CMD. Panel (b) shows the mF814W vs. mF438W − mF814W CMD of all sources with measured PMs towards NGC 1850 (grey dots) and the final selection of well-measured cluster stars (black dots). Panels (c) and (d) show, separately for each PM component, the maps of the local mean raw PM field (before the high-frequency correction). Each point in the map is colour-coded according to the median PM of its closest 200 well-measured cluster stars. The corresponding maps of the a posteriori corrected PMs are displayed in panels (e) and (f). The points in these maps are coloured according to the same range in colour as in panels (c) and (d).
Current usage metrics show cumulative count of Article Views (full-text article views including HTML views, PDF and ePub downloads, according to the available data) and Abstracts Views on Vision4Press platform.
Data correspond to usage on the plateform after 2015. The current usage metrics is available 48-96 hours after online publication and is updated daily on week days.
Initial download of the metrics may take a while.