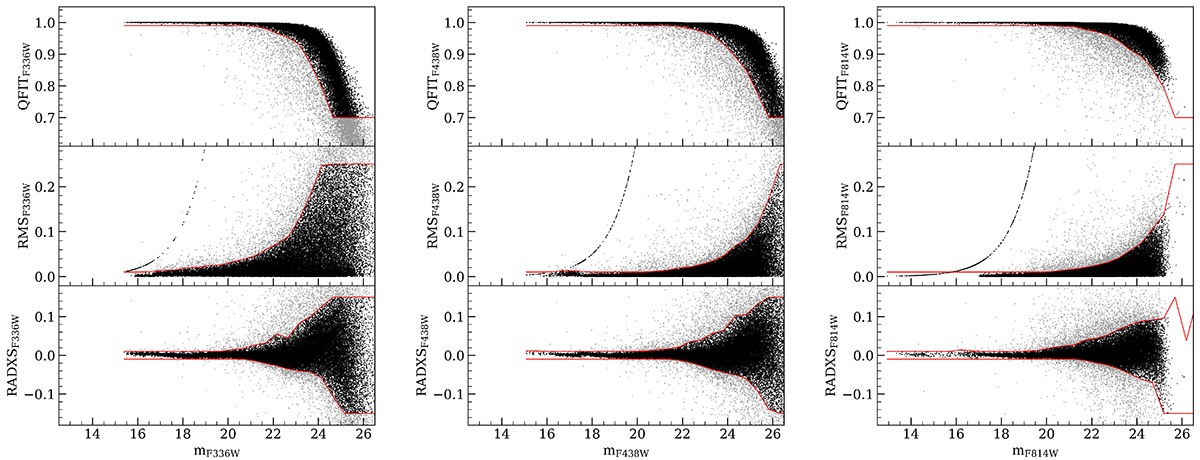
Fig. 4.

Download original image
Selection of well-measured stars, based on photometric quality parameters, for the cluster NGC 1850. The three sub-plots correspond to observations taken within epoch 3 (2015) in the filters F336W, F438W and F814W (from left to right). Within each sub-plot, the panels refer to selections based on the QFIT parameter (top panels), the photometric RMS (middle panels) and RADXS parameter (bottom panels). Within each panel the red line follows the magnitude-dependent selection criteria used to separate well-measured stars (black dots) from those with bad quality measurements (grey dots). Stars that are only measured in a single exposure, follow the exponential-like function in the panels showing the RMS distribution.
Current usage metrics show cumulative count of Article Views (full-text article views including HTML views, PDF and ePub downloads, according to the available data) and Abstracts Views on Vision4Press platform.
Data correspond to usage on the plateform after 2015. The current usage metrics is available 48-96 hours after online publication and is updated daily on week days.
Initial download of the metrics may take a while.


