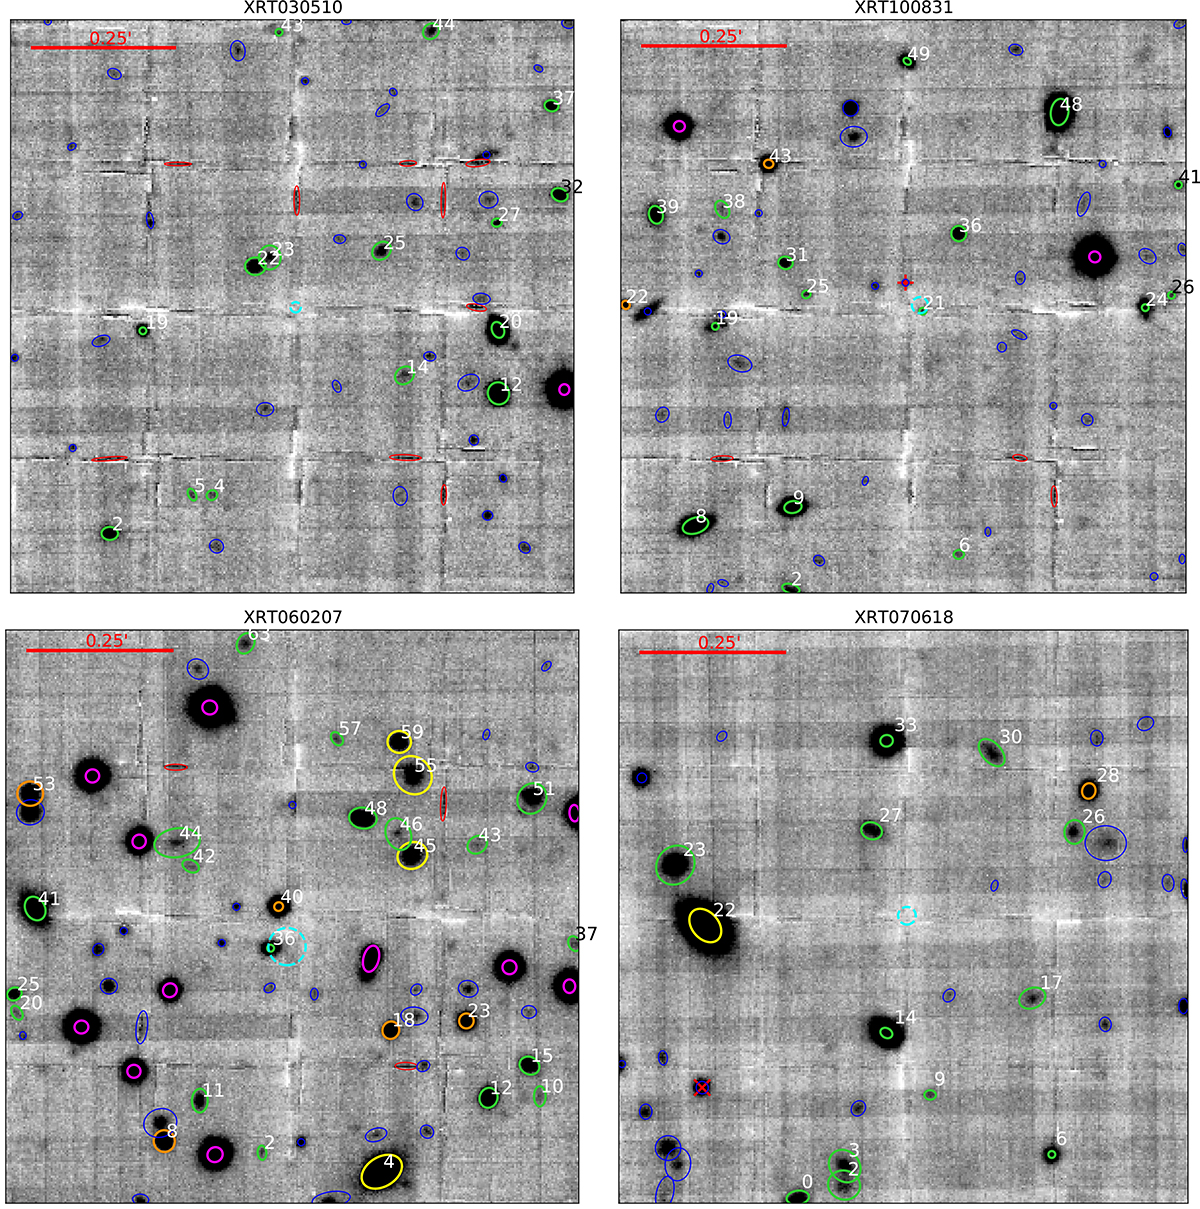
Fig. 1.
Download original image
High-contrast greyscale 1 × 1 arcmin R-band images obtained from the MUSE data cubes. The position of each FXT is indicated by a dashed cyan circle near the centre of the image. Its size represents the 1σ uncertainty on the X-ray position of the FXT. Every ellipse indicates the position of a source detected by SEP, with different colours for different types of sources. Green ellipses show sources for which we detected emission lines in the spectra to which we fit Gaussian functions to determine the redshift. Yellow ellipses indicate sources for which we used the Ca H+K absorption lines to estimate a redshift and used PPXF to obtain a more accurate redshift measurement. Orange ellipses indicate sources that were identified as dwarf stars, and pink ellipses show sources that are normal stars. The red ellipses were filtered out by our selection criteria based on flags and elongation. We extracted a spectrum for blue sources, but the signal-to-noise ratio was too low to detect emission lines or use PPXF to obtain the redshift. We note that due to the high contrast of the image needed to show all faint sources, not all sources that appear bright have a high S/N spectrum. We plot the spectrum of the source with an R-band magnitude of 22.76 ± 0.06, marked with a red cross in the image of XRT 070618 in Figure 2 to give an example of a bright source for which we were unable to determine the redshift. The sizes of the ellipses show the extraction region used to obtain the spectrum for each source (see Section 3.3 for how the size and shape were determined). The sources for which we were able to obtain a redshift are labelled with numbers that correspond to the numbers listed in Table A.1. Orange ellipses are labelled with numbers corresponding to the source numbers listed in Table 2. North is up and east is left in these images.
Current usage metrics show cumulative count of Article Views (full-text article views including HTML views, PDF and ePub downloads, according to the available data) and Abstracts Views on Vision4Press platform.
Data correspond to usage on the plateform after 2015. The current usage metrics is available 48-96 hours after online publication and is updated daily on week days.
Initial download of the metrics may take a while.