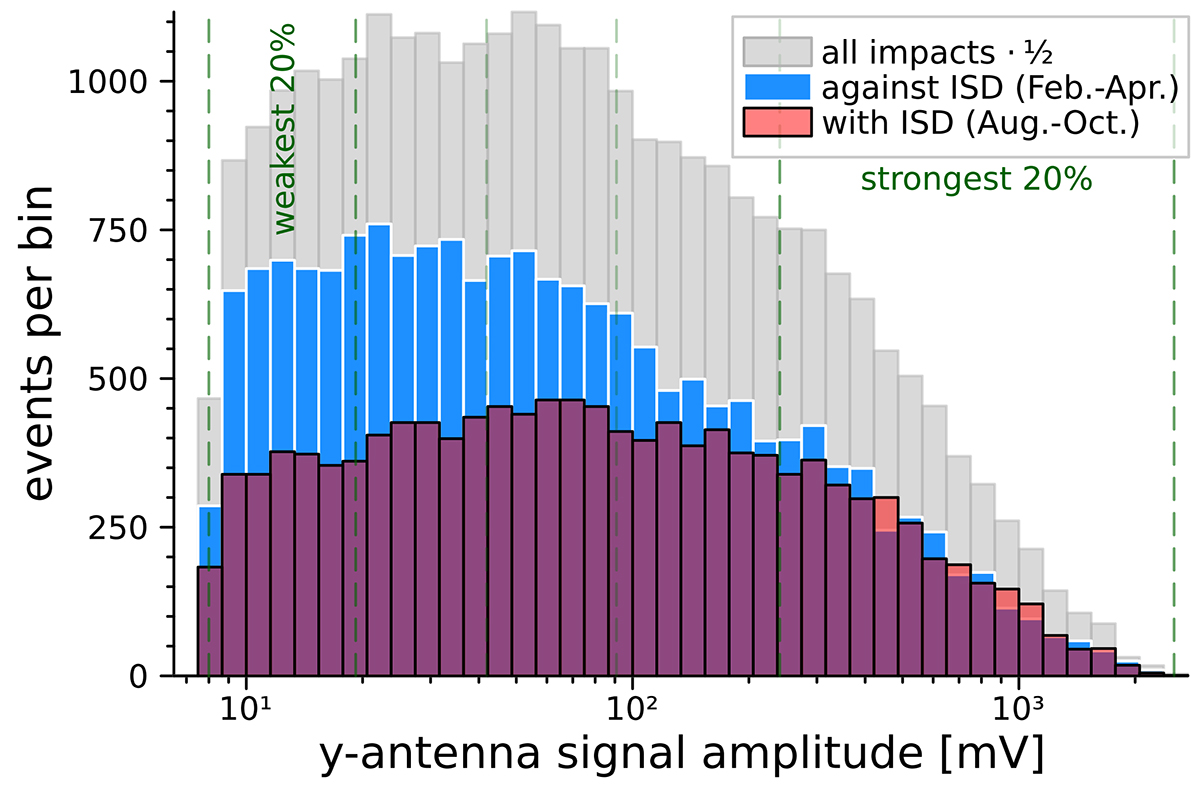
Fig. 8.
Download original image
Amplitude distributions of all impacts (grey bars) with morphological types A and B measured by the y-antenna, impacts measured only when the spacecraft moved against the ISD inflow direction during February, March, and April (shown with blue filled bars outlined in white), and impacts measured only when the spacecraft moved with the ISD inflow direction during August, September, and October (shown with red filled bars outlined in black). The distribution of all impacts has been scaled by a factor of 0.5 to tighten the histogram’s vertical axis. The vertical dashed green lines indicate every 20th percentile of the signal amplitude; the weakest and the strongest 20% of all impact signals were selected when generating Fig. 7.
Current usage metrics show cumulative count of Article Views (full-text article views including HTML views, PDF and ePub downloads, according to the available data) and Abstracts Views on Vision4Press platform.
Data correspond to usage on the plateform after 2015. The current usage metrics is available 48-96 hours after online publication and is updated daily on week days.
Initial download of the metrics may take a while.