Open Access
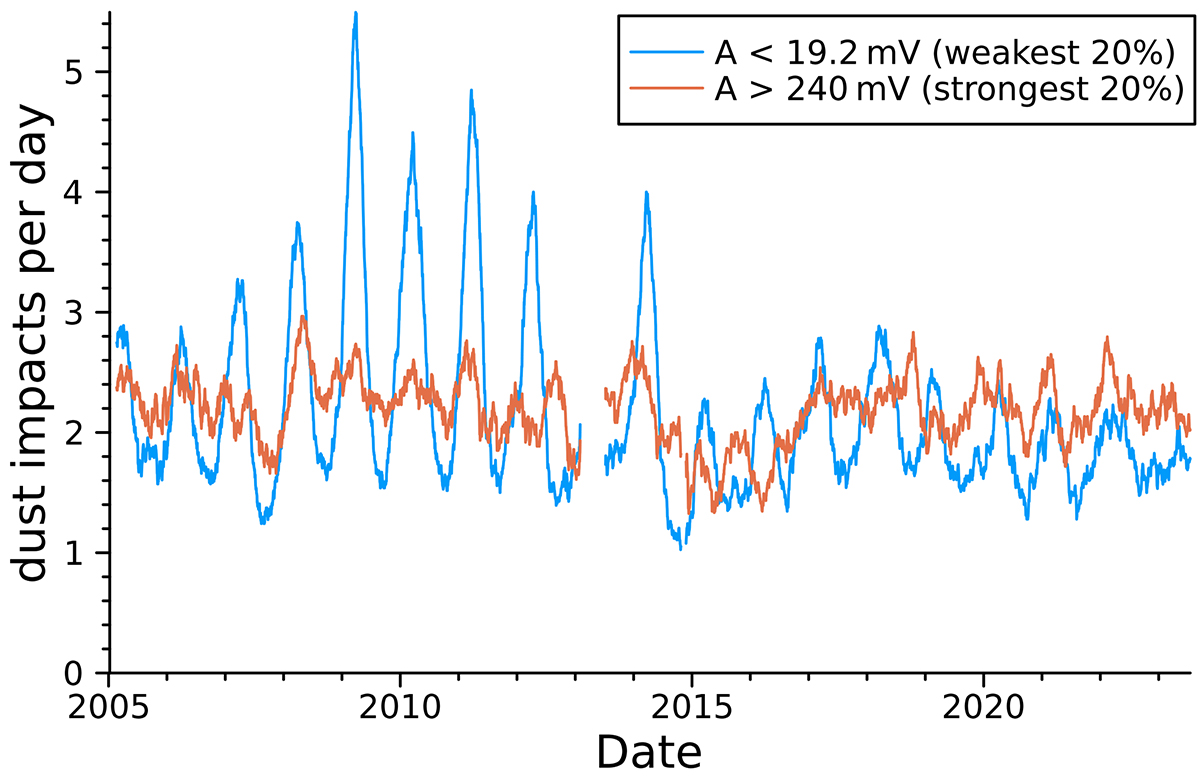
Fig. 7.
Download original image
Time series for all dust impacts of morphological types A and B with a y-antenna signal amplitude below 19.2 mV (blue) and above 240 mV (red), graphed as a centred moving average with a width of 91 d. The two amplitude selections each correspond to 20% of all impacts.
Current usage metrics show cumulative count of Article Views (full-text article views including HTML views, PDF and ePub downloads, according to the available data) and Abstracts Views on Vision4Press platform.
Data correspond to usage on the plateform after 2015. The current usage metrics is available 48-96 hours after online publication and is updated daily on week days.
Initial download of the metrics may take a while.