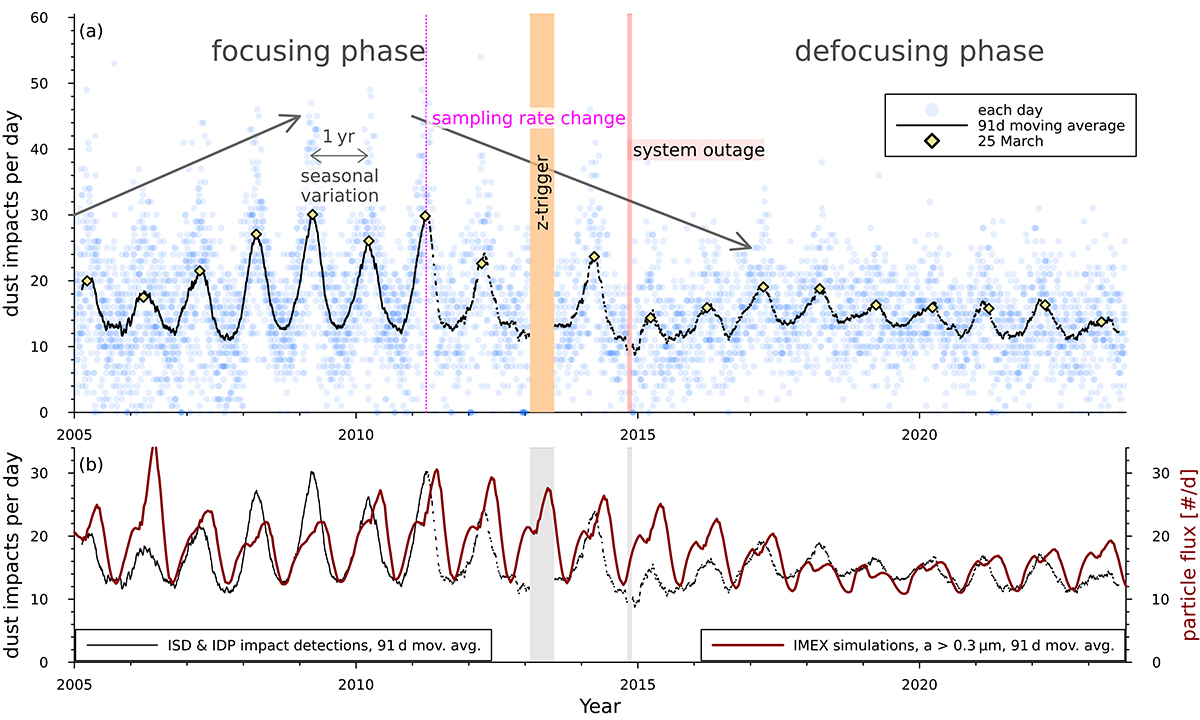
Fig. 6.
Download original image
Dust impacts observed by Wind versus time. Top panel: Daily number of dust impacts on Wind at L1 that generated signals of morphological types A and B, given for each day (blue discs) and as a centred moving average with a width of 91 d (black line). For comparison, yellow diamonds mark the moving average flux on 25 March of each year, which is close to each annual maximum. The sampling rate was periodically changed beginning in April 2011, marked by a vertical dotted pink line, making the instrument insensitive to dust impacts for roughly two days every six days. Larger time periods where the instrument was inoperable in regard to measuring dust impacts occurred in 2013 (shaded orange, “z-trigger”) and in late 2014 (shaded red, “system outage”). The increase and decrease of dust impacts due to the solar magnetic cycle is indicated by diagonal grey arrows. The dataset has been corrected for these instrumental effects as per Sect. 3.3 (see Appendix A). Bottom panel: Daily number of dust impacts observed by Wind as a 91 d centred moving average (black curve, identical to the top panel) compared to the numerically simulated particle flux of ISD at Wind’s orbital position, vertically offset by an assumed constant IDP flux of 10 #/d. (For more information on the simulations, see Sect. 3.4.1).
Current usage metrics show cumulative count of Article Views (full-text article views including HTML views, PDF and ePub downloads, according to the available data) and Abstracts Views on Vision4Press platform.
Data correspond to usage on the plateform after 2015. The current usage metrics is available 48-96 hours after online publication and is updated daily on week days.
Initial download of the metrics may take a while.