Open Access
Fig. B.8.
Download original image
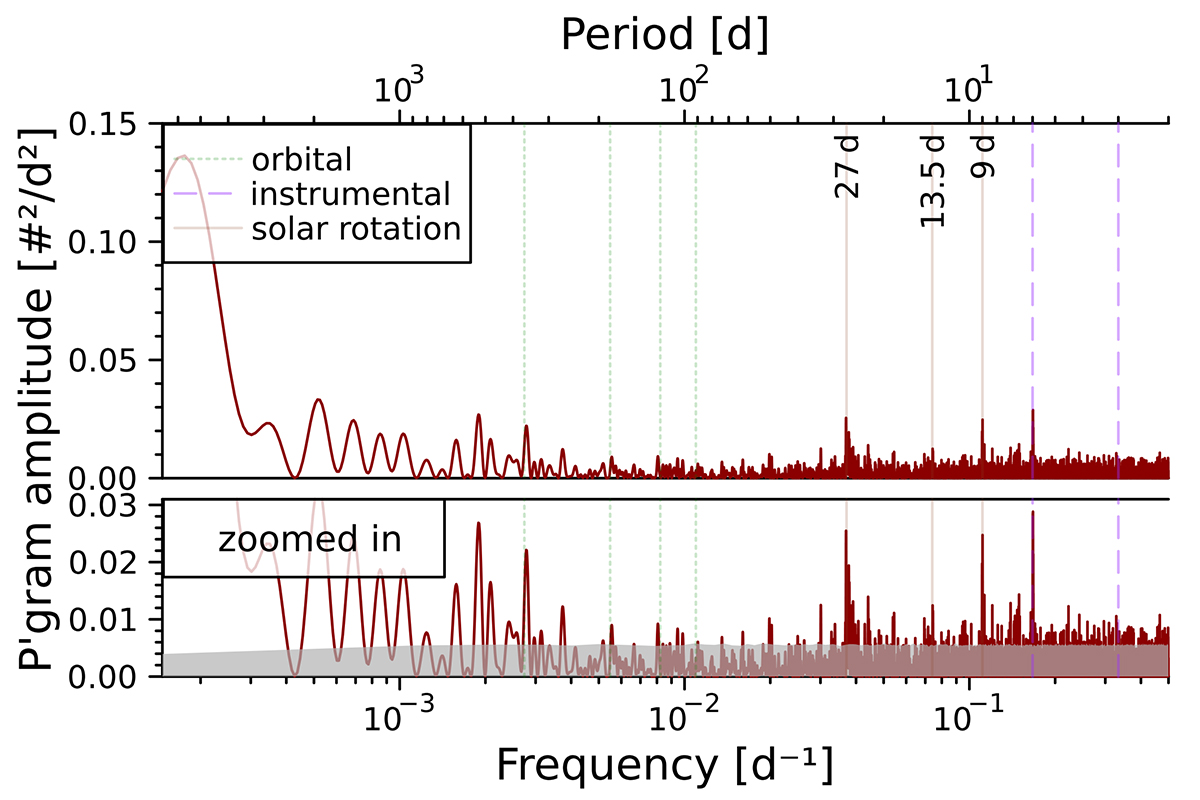
Periodogram of the daily number of dust impacts with morphological types C and D observed at L1, marked as in Fig. 9. The bottom panel shows a zoomed-in view of the full spectrum with the estimated 95% significance thresholds indicated by a grey shaded area.
Current usage metrics show cumulative count of Article Views (full-text article views including HTML views, PDF and ePub downloads, according to the available data) and Abstracts Views on Vision4Press platform.
Data correspond to usage on the plateform after 2015. The current usage metrics is available 48-96 hours after online publication and is updated daily on week days.
Initial download of the metrics may take a while.