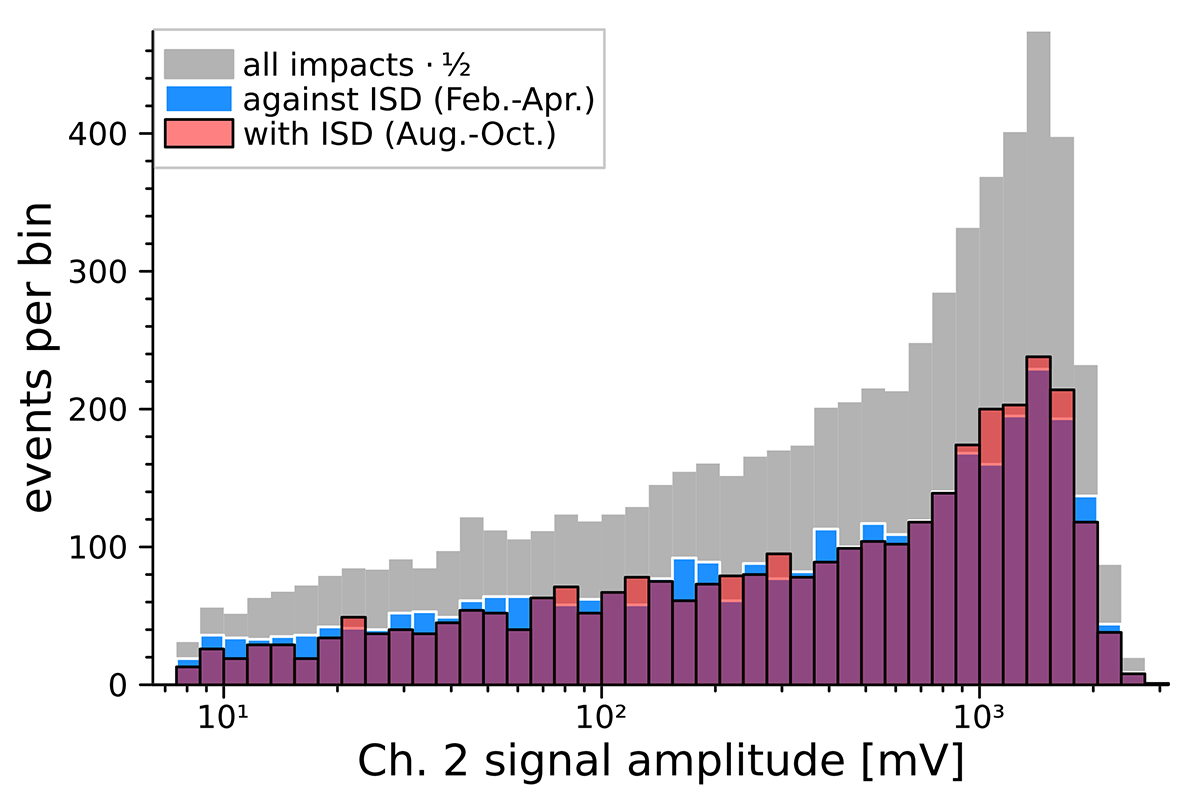
Fig. B.7.
Download original image
Amplitude distributions of all impacts (grey) with morphological types C and D measured by the y-antenna, impacts measured only when the spacecraft moved against the ISD inflow direction (February to April; blue and white), and impacts measured only when the spacecraft moved with the ISD inflow direction (August to October; red and black). The distribution of all impacts has been scaled by a factor of 0.5 to tighten the histogram’s vertical axis (see Fig. 8.)
Current usage metrics show cumulative count of Article Views (full-text article views including HTML views, PDF and ePub downloads, according to the available data) and Abstracts Views on Vision4Press platform.
Data correspond to usage on the plateform after 2015. The current usage metrics is available 48-96 hours after online publication and is updated daily on week days.
Initial download of the metrics may take a while.