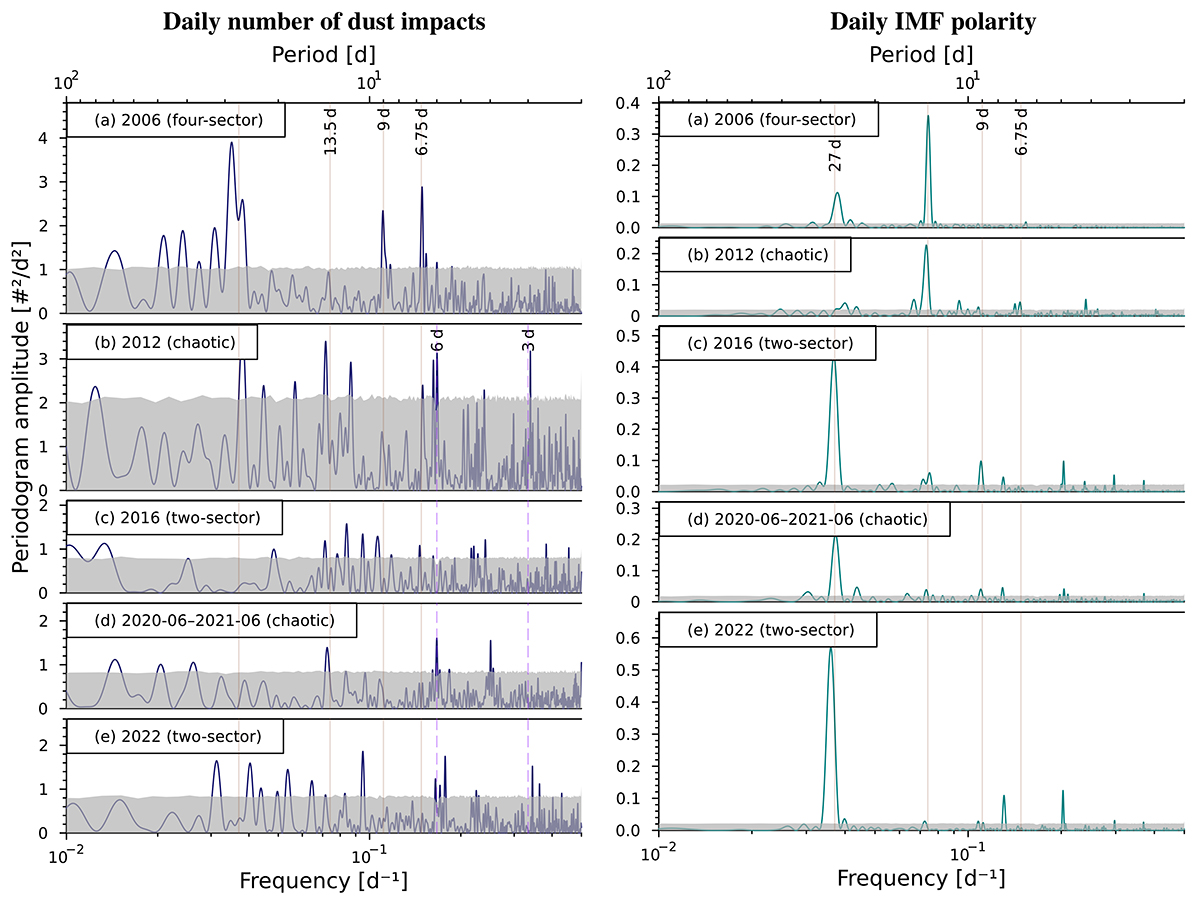
Fig. B.5.
Download original image
Periodograms for certain time periods corresponding to different sector structures of the IMF, the daily number of dust impacts with morphological types A and B (left, indigo curves), and the sector boundary structure (right, teal curves). All selected time periods last 1 yr. The axes of the periodogram amplitude are scaled identically within each column. The vertical lines are as in Fig. 14. The estimated 95% significance thresholds are indicated by grey shaded areas.
Current usage metrics show cumulative count of Article Views (full-text article views including HTML views, PDF and ePub downloads, according to the available data) and Abstracts Views on Vision4Press platform.
Data correspond to usage on the plateform after 2015. The current usage metrics is available 48-96 hours after online publication and is updated daily on week days.
Initial download of the metrics may take a while.