Fig. B.3.
Download original image
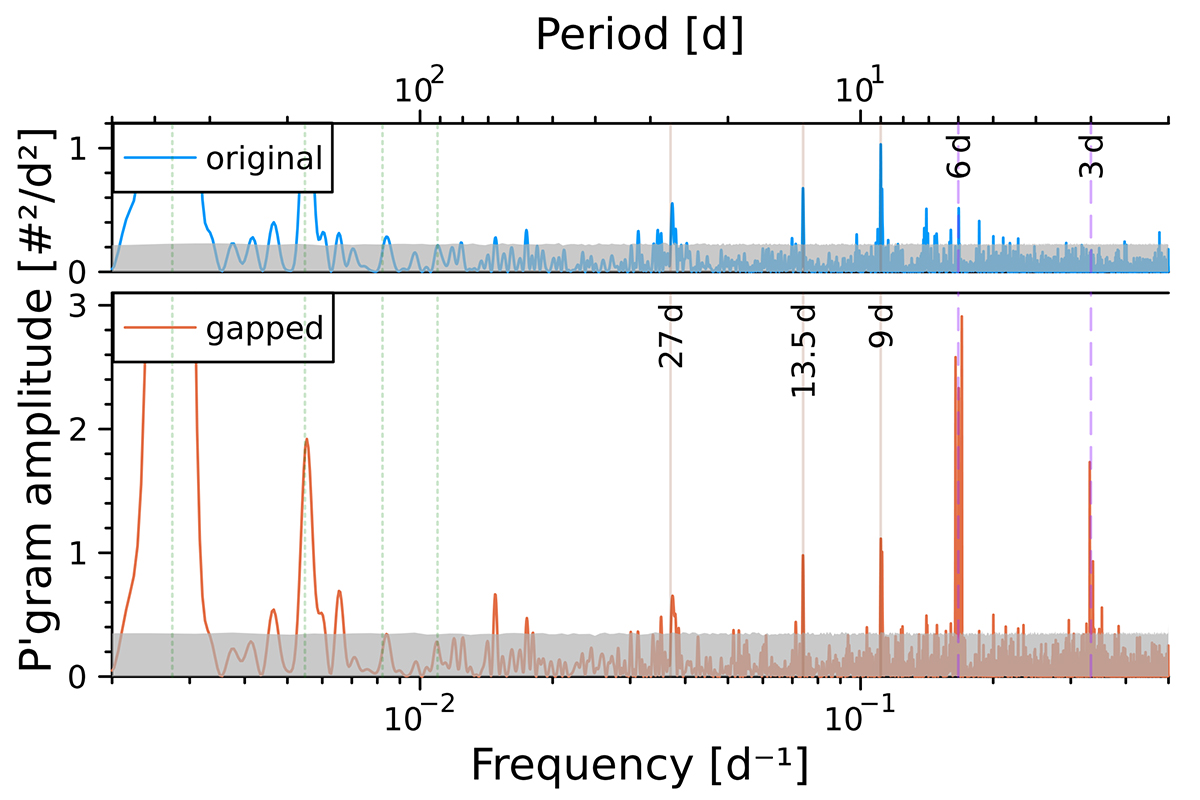
Periodogram of the daily number of dust impacts with morphological types A and B before April 2011, original data (blue curve, top panel) and data with artificially induced 6 d-periodic gaps (orange curve, bottom panel), evaluated at the DFT’s natural frequencies and oversampled by a factor of five. The two panels are scaled identically. Frequencies of interest are marked by vertical lines, as in Fig. 9. The estimated 95% significance thresholds are indicated by grey shaded areas.
Current usage metrics show cumulative count of Article Views (full-text article views including HTML views, PDF and ePub downloads, according to the available data) and Abstracts Views on Vision4Press platform.
Data correspond to usage on the plateform after 2015. The current usage metrics is available 48-96 hours after online publication and is updated daily on week days.
Initial download of the metrics may take a while.