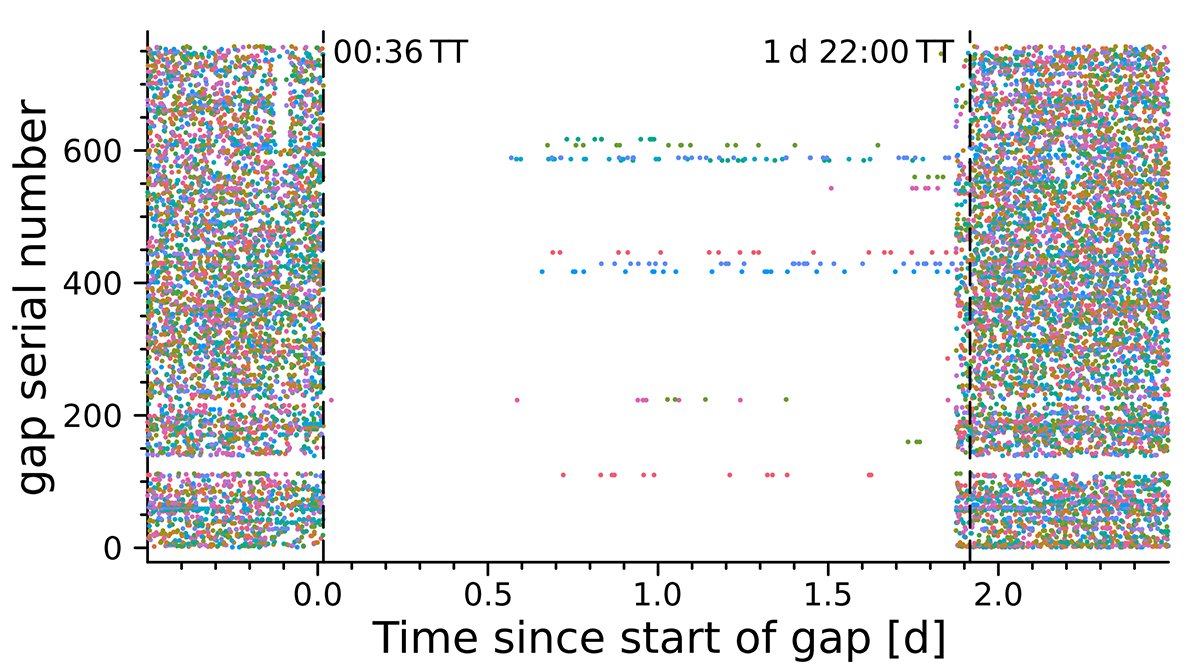
Fig. B.2.
Download original image
Superposed epoch analysis of all gaps stemming from the 6 d-periodic sampling rate change; serial number of the gaps versus time since the start of the two days of removed data. Each dot corresponds to one observed dust impact; each line of identically coloured dots corresponds to the same epoch, i.e. gap serial number. The vertical dashed black lines correspond to the reported timing of the sampling rate change.
Current usage metrics show cumulative count of Article Views (full-text article views including HTML views, PDF and ePub downloads, according to the available data) and Abstracts Views on Vision4Press platform.
Data correspond to usage on the plateform after 2015. The current usage metrics is available 48-96 hours after online publication and is updated daily on week days.
Initial download of the metrics may take a while.