Fig. A.4.
Download original image
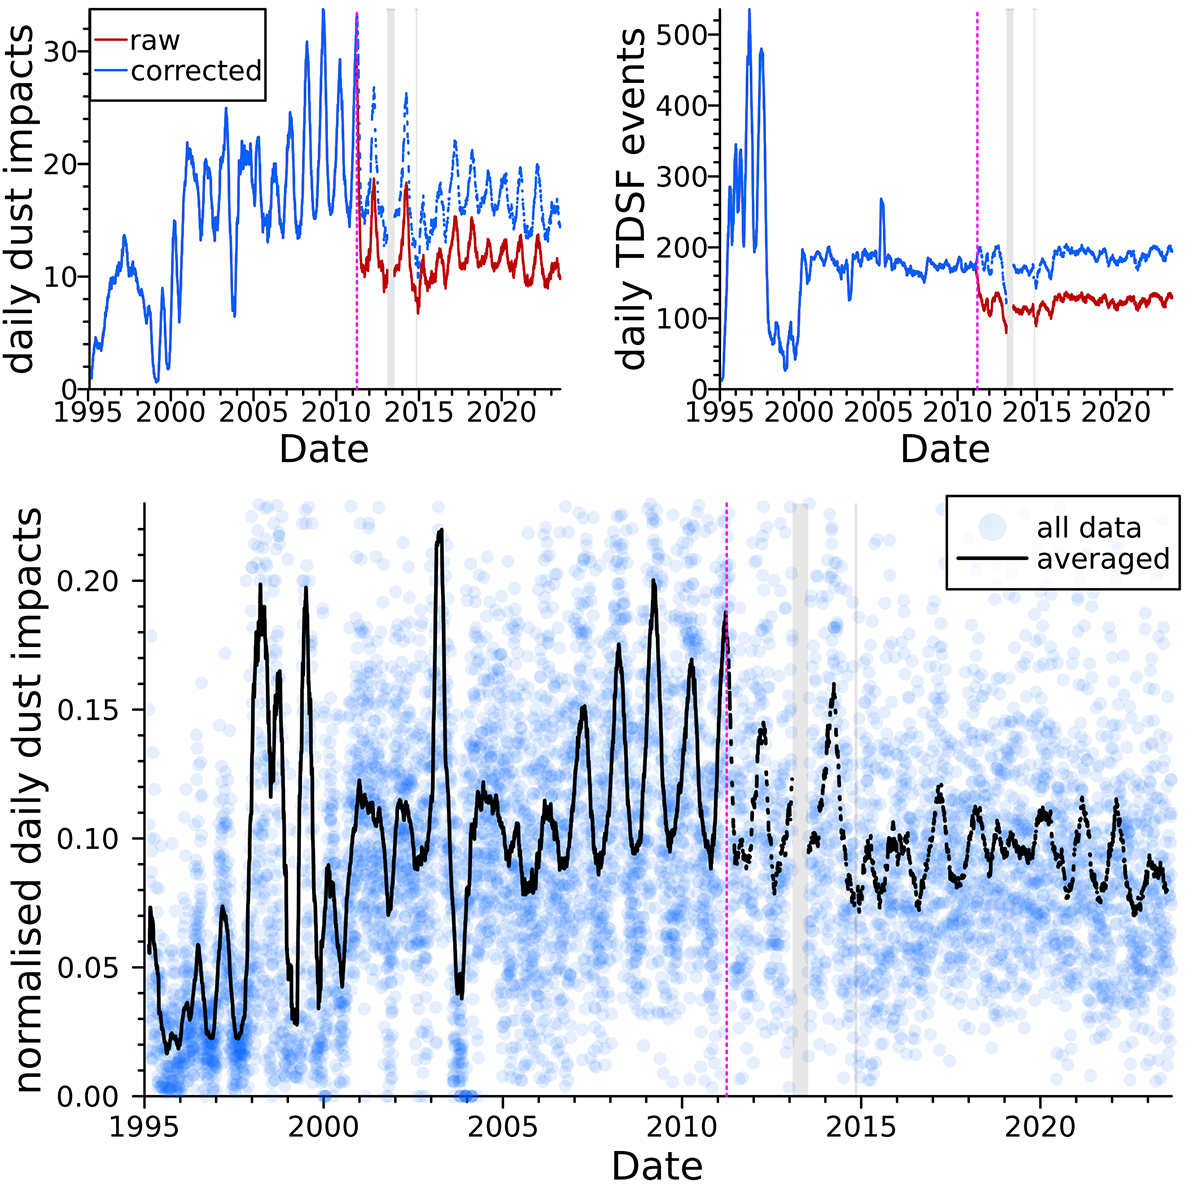
Daily number of dust impacts and TDSF events, corrected for the sampling rate change in April 2004. Top panel: Daily number of dust impacts (left) and daily number of TDSF events (right) as moving averages with centred windows of 91 d. The red curves depict the “raw” data – same as in Figs. A.1 and A.3 but additionally taking into account the data gaps of 2013 and 2014, which are marked by grey bars. The blue curves depict the same data but corrected for the change of the sampling rate in April 2011, which is marked by a vertical dotted magenta line. Bottom panel: Daily number of dust impacts normalised by the daily number of TDSF events, graphed for each individual day (blue discs) and as a moving average with a centred window of 91 d (black curve). The data have been corrected for the sampling rate change and the data gaps.
Current usage metrics show cumulative count of Article Views (full-text article views including HTML views, PDF and ePub downloads, according to the available data) and Abstracts Views on Vision4Press platform.
Data correspond to usage on the plateform after 2015. The current usage metrics is available 48-96 hours after online publication and is updated daily on week days.
Initial download of the metrics may take a while.