Fig. 17.
Download original image
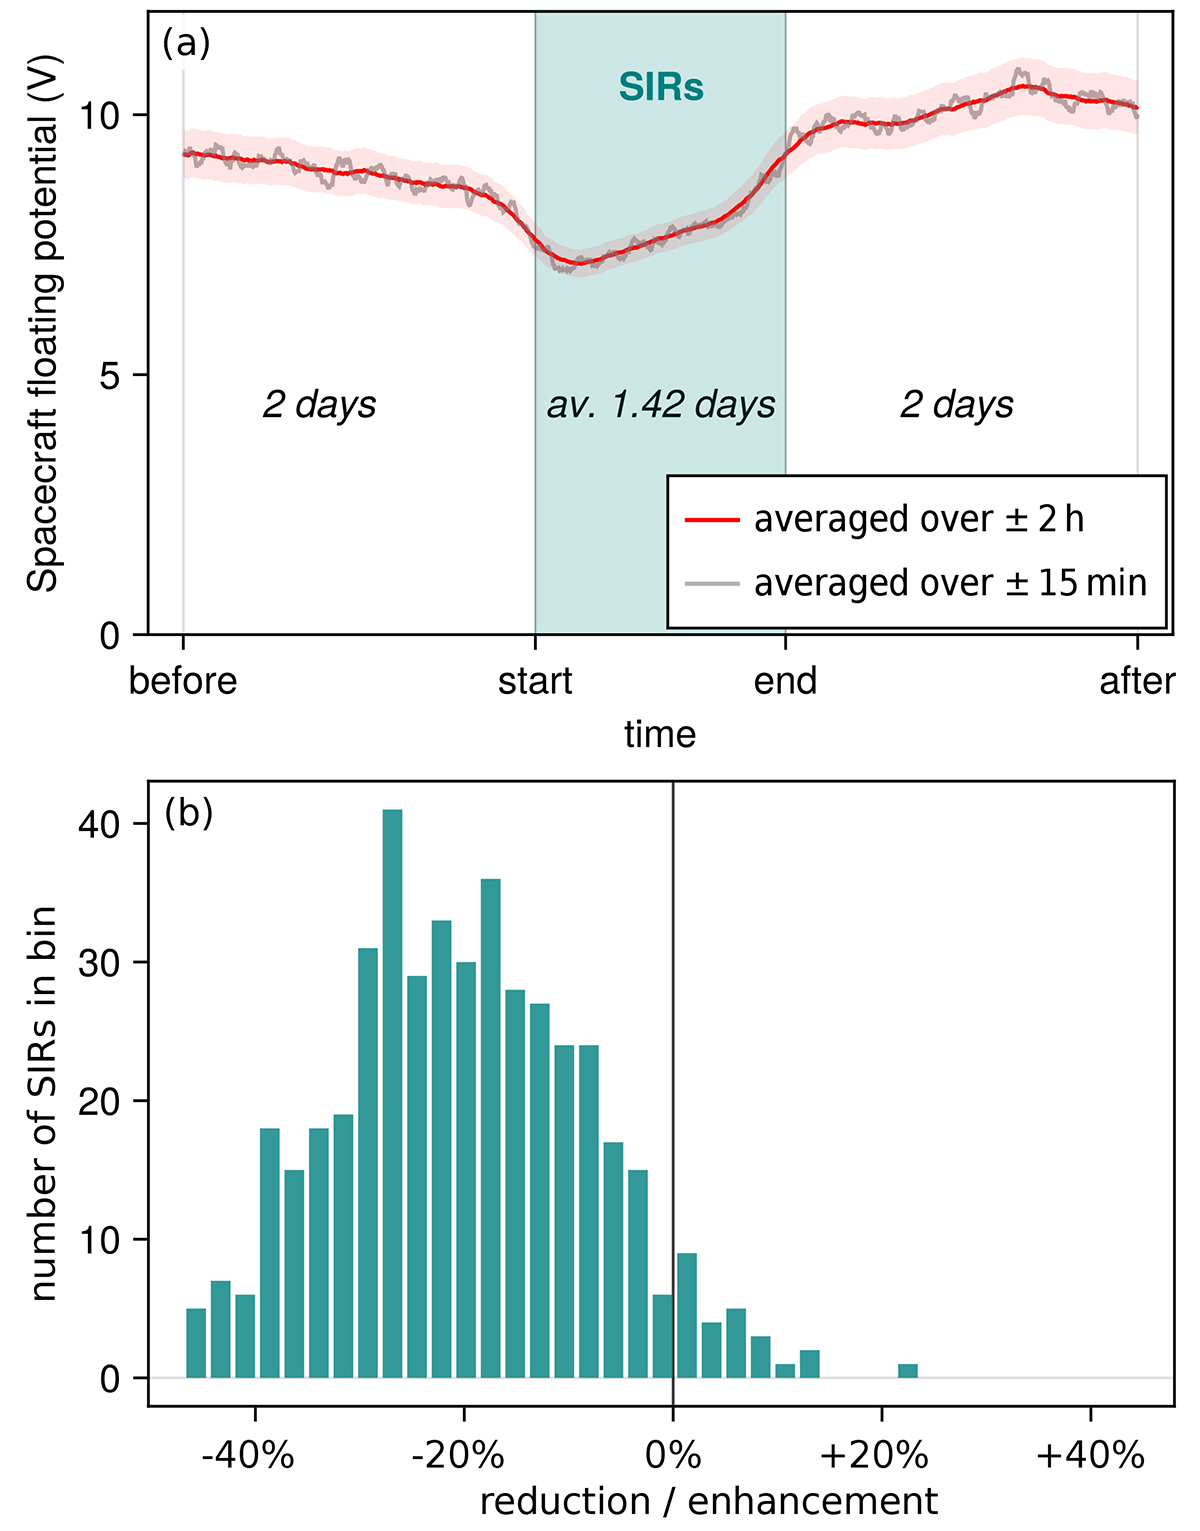
Scaled superposed epoch analysis (top panel) and histogram of the reduction or enhancement during each event (bottom panel) of Wind’s floating potential during all SIRs that are associated with CIRs since 2005, in analogy to Fig. 12. The shaded red confidence band in the top panel corresponds to the standard deviation and a 1 V measurement uncertainty for individual measurements of the floating potential. The first fourteen SIRs of 2005 were not taken into account because no spacecraft floating potential data was available.
Current usage metrics show cumulative count of Article Views (full-text article views including HTML views, PDF and ePub downloads, according to the available data) and Abstracts Views on Vision4Press platform.
Data correspond to usage on the plateform after 2015. The current usage metrics is available 48-96 hours after online publication and is updated daily on week days.
Initial download of the metrics may take a while.