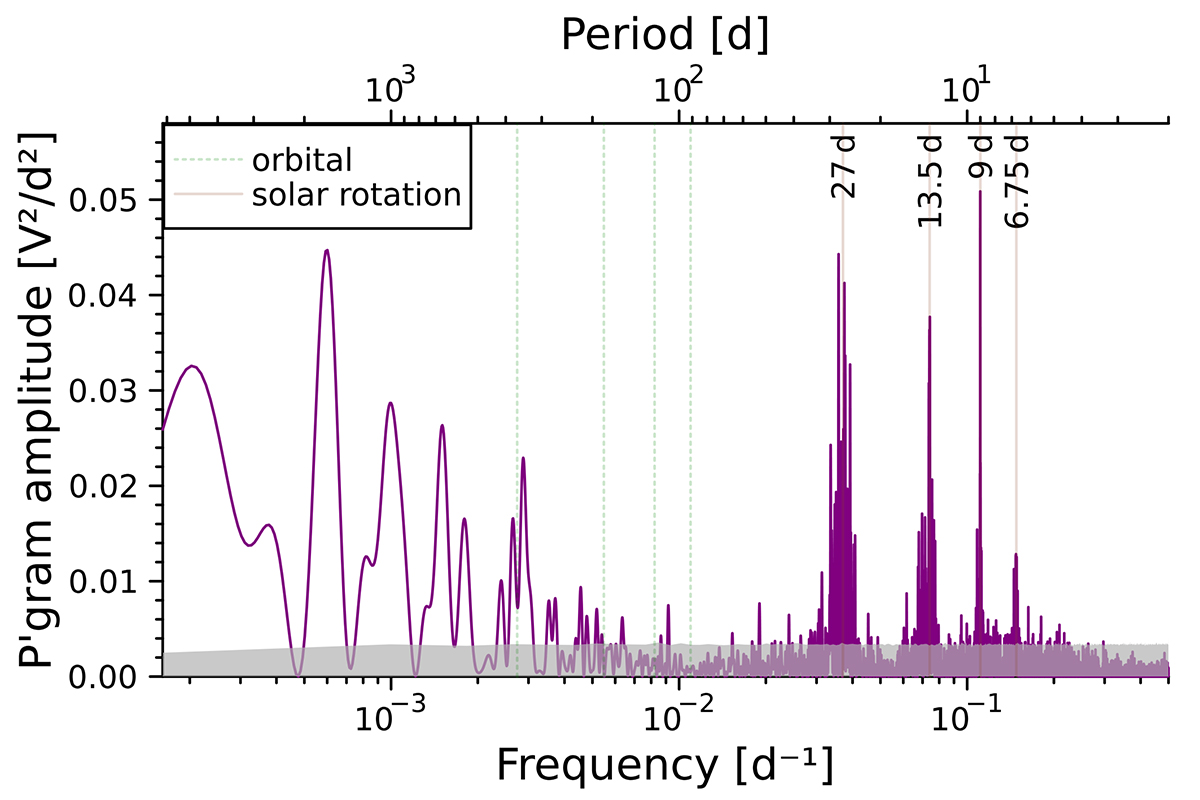
Fig. 16.
Download original image
Periodogram of Wind’s floating potential from 2005 to 2021 using Method 4 of Wilson et al. (2023a) for parallel pitch angles (cf. Wilson et al. 2023a, Fig. 6). The data were averaged over each day before generating the spectrum. The vertical lines are as in Fig. 9. The estimated 95% significance thresholds are indicated by a grey shaded area.
Current usage metrics show cumulative count of Article Views (full-text article views including HTML views, PDF and ePub downloads, according to the available data) and Abstracts Views on Vision4Press platform.
Data correspond to usage on the plateform after 2015. The current usage metrics is available 48-96 hours after online publication and is updated daily on week days.
Initial download of the metrics may take a while.