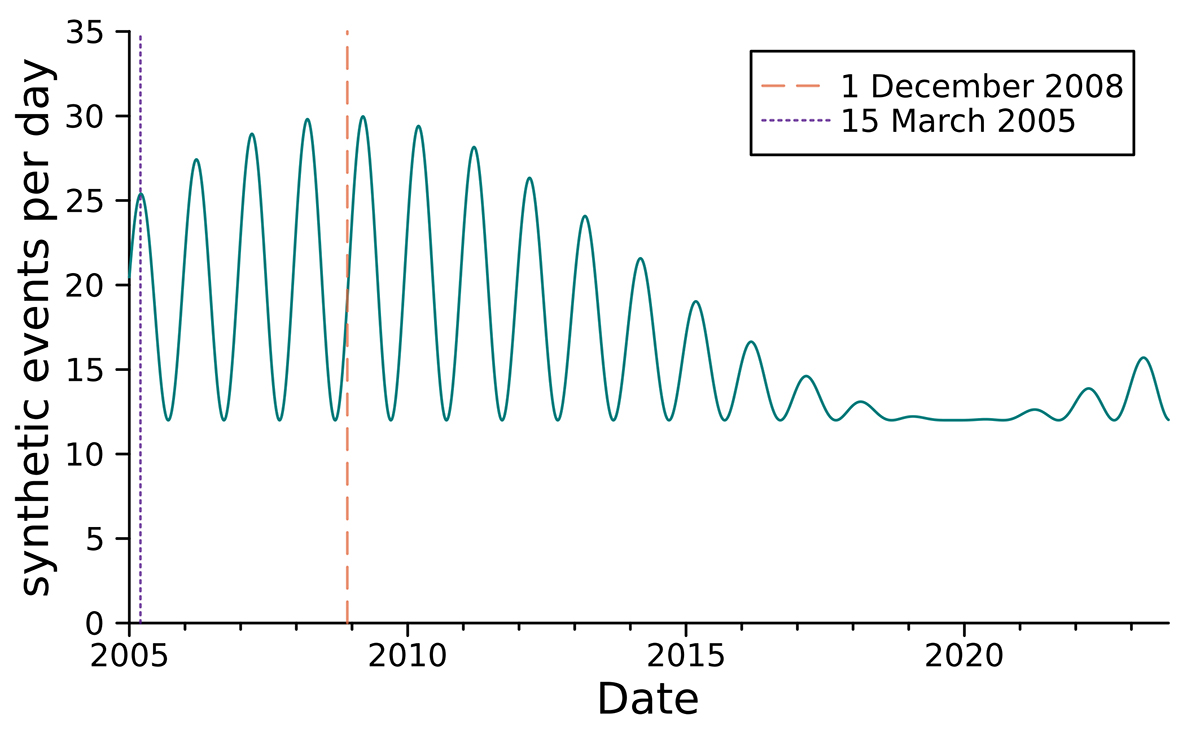
Fig. 15.
Download original image
Synthetic time series of IDP and ISD impacts on Wind following Eq. (6) to reproduce the observed number of impacts in Fig. 6a. The times at which the oscillations due to the solar magnetic cycle and the annual variation are at their maxima are indicated by a vertical dashed red line and a vertical dotted purple line, respectively.
Current usage metrics show cumulative count of Article Views (full-text article views including HTML views, PDF and ePub downloads, according to the available data) and Abstracts Views on Vision4Press platform.
Data correspond to usage on the plateform after 2015. The current usage metrics is available 48-96 hours after online publication and is updated daily on week days.
Initial download of the metrics may take a while.