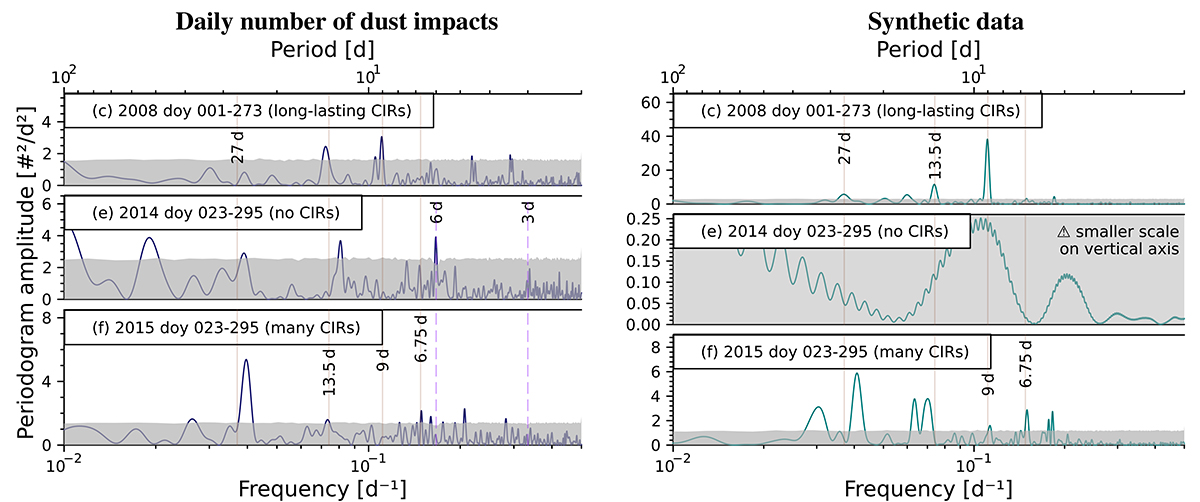
Fig. 14.
Download original image
Periodograms for certain time periods corresponding to different systematic rates of occurrence of CIRs for the daily number of dust impacts with morphological types A and B (left, indigo curves) and of a synthetic time series of dust impacts with an absolute dust depletion by SIRs (right, teal curves; see Sect. 4.3.3). All of the selected time periods are nine months long; their initial and final dates are given as doy. All panels in the left column share the same axis range and scale for easier comparison. The panels in the right column are scaled differently. Frequencies of interest are marked by vertical red lines as in Fig. 9, including the third solar rotation harmonic at 6.75 d; the 6 d-periodicity has only been marked in the dust impact spectra since 2011. Estimated 95% significance thresholds are indicated by grey shaded areas.
Current usage metrics show cumulative count of Article Views (full-text article views including HTML views, PDF and ePub downloads, according to the available data) and Abstracts Views on Vision4Press platform.
Data correspond to usage on the plateform after 2015. The current usage metrics is available 48-96 hours after online publication and is updated daily on week days.
Initial download of the metrics may take a while.