Fig. 13.
Download original image
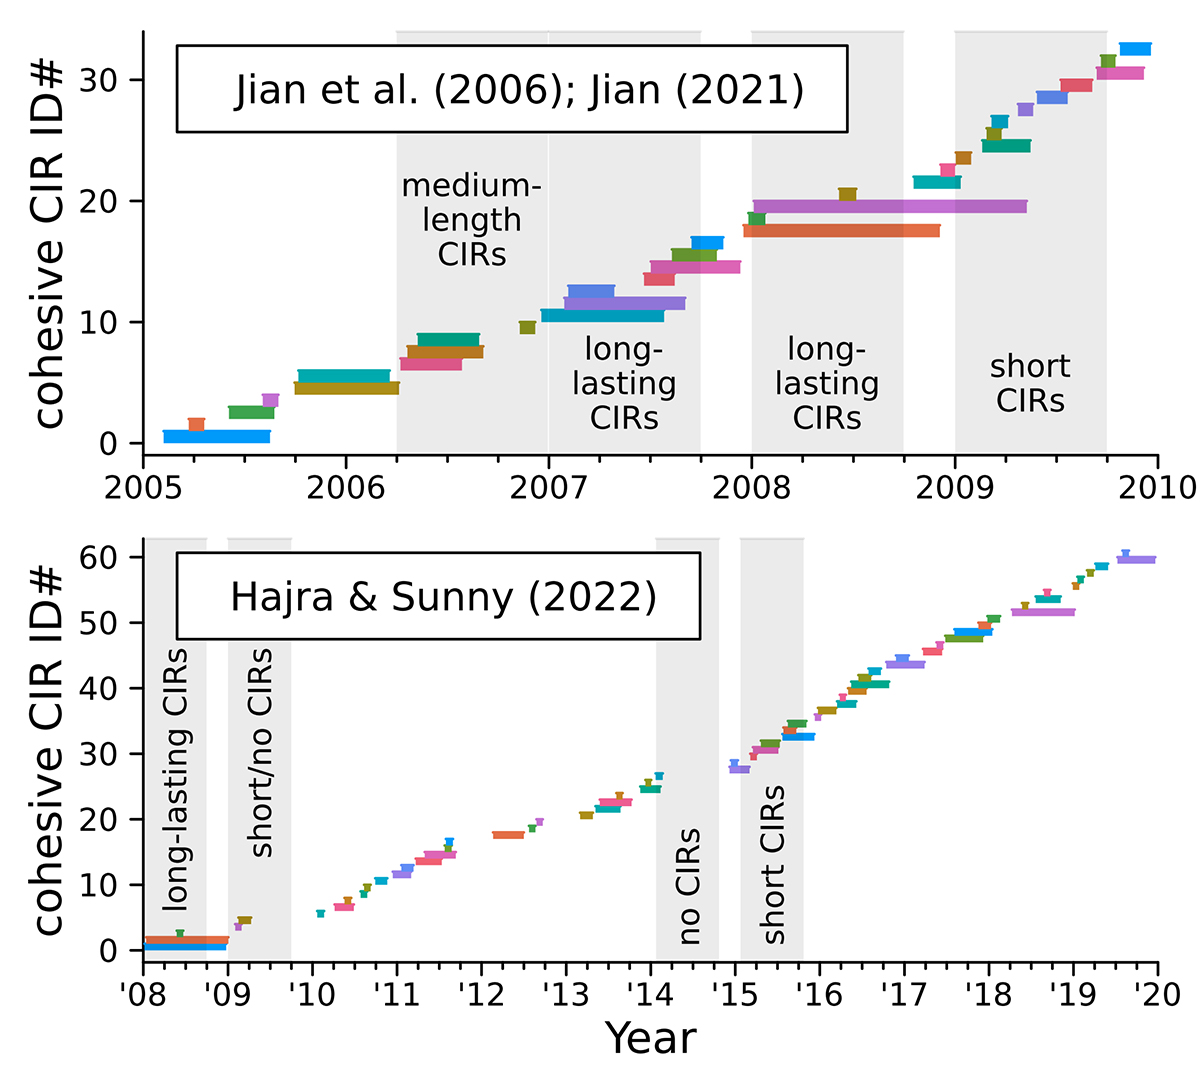
CIRs identified by the method proposed in Sect. 4.3.2 for the SIR datasets of Jian et al. (2006), Jian (2021) since 2005 (top panel) and Hajra & Sunny (2022) (bottom panel). Each horizontal bar corresponds to one CIR. Time intervals of interest have been highlighted by shaded areas. We note that the two datasets overlap only for the years 2008 and 2009.
Current usage metrics show cumulative count of Article Views (full-text article views including HTML views, PDF and ePub downloads, according to the available data) and Abstracts Views on Vision4Press platform.
Data correspond to usage on the plateform after 2015. The current usage metrics is available 48-96 hours after online publication and is updated daily on week days.
Initial download of the metrics may take a while.