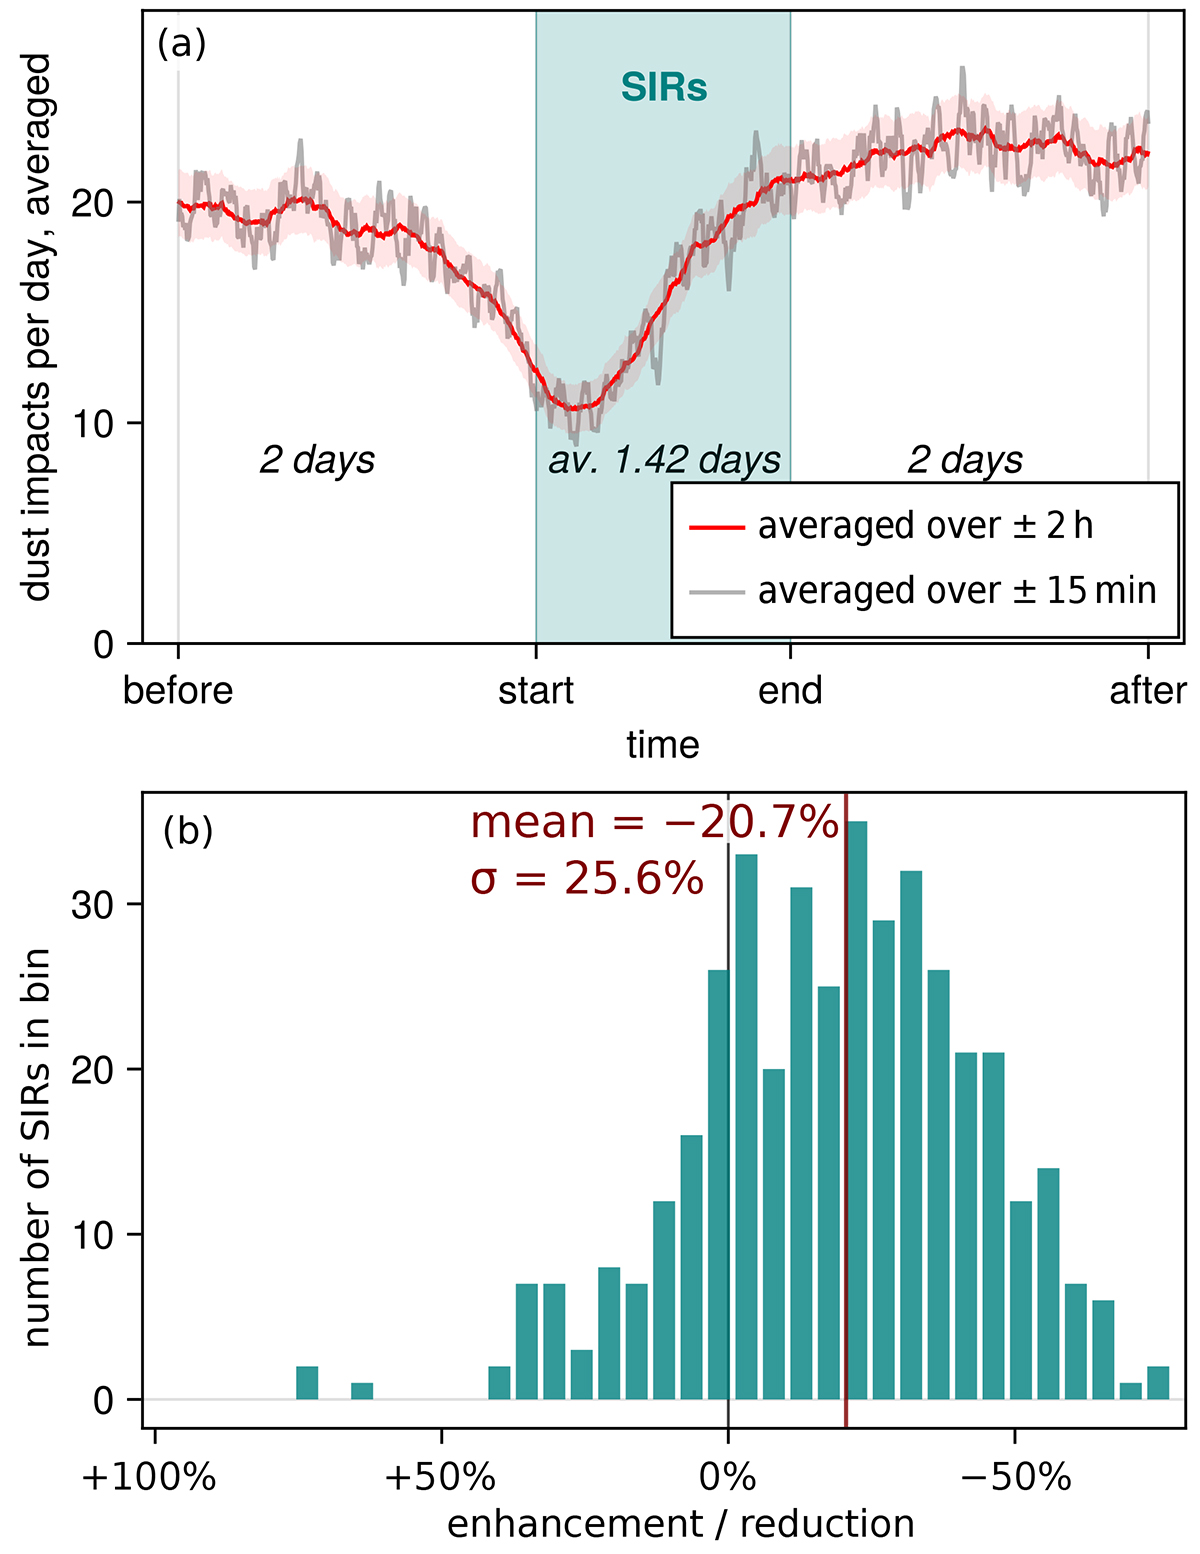
Fig. 12.
Download original image
Reduction and enhancement of dust impact detections made by Wind during SIRs. Top panel: Scaled superposed epoch analysis of the daily number of dust impacts during SIRs as a moving average within a 30 min interval (grey) or a 4 h interval (red). Only the SIRs that are associated with CIRs were taken into account. The shaded red area indicates 95% confidence intervals for a Poissonian distribution. Bottom panel: Histogram of the enhancement or reduction factor of dust impacts for the SIRs that are associated with CIRs. The dashed blue line denotes the average reduction of 20.7%. The five SIRs that begin on 1 January 2005, 23 November 2006, 15 January 2007, 24 November 2008, and 30 August 2009 were excluded due to low number statistics.
Current usage metrics show cumulative count of Article Views (full-text article views including HTML views, PDF and ePub downloads, according to the available data) and Abstracts Views on Vision4Press platform.
Data correspond to usage on the plateform after 2015. The current usage metrics is available 48-96 hours after online publication and is updated daily on week days.
Initial download of the metrics may take a while.